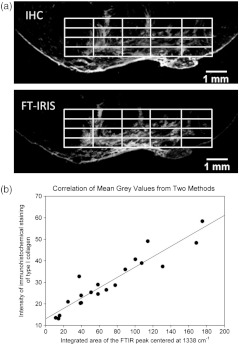
Fig. 2.
Comparison of intensity maps from FT-IRIS and immunohistochemical staining (IHC) in a representative sample. Panel a shows the image of the infarct region from both techniques after being resized and aligned to match. A grid of was applied to the same area of in both images. In panel b, mean gray values in each grid element were compared between two methods in a Pearson correlation model.

