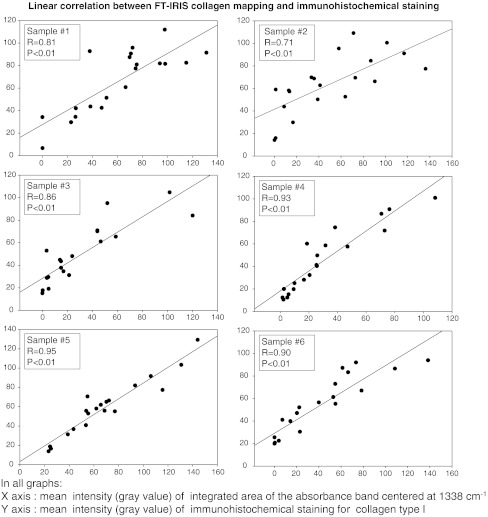
Fig. 4.
Pearson correlation for local collagen intensity between the FT-IRIS method and immunohistochemical staining in consecutive sections from six samples. In each sample, mean gray values of 20 sequential grid elements were measured and correlated in intensity images created from integrated area of the band centered at (X axis) versus immunohistochemical staining of collagen type I (Y axis) (average for six , average value for six ).

