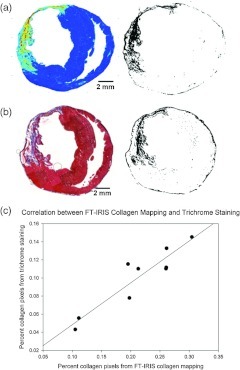
Fig. 5.
Comparison of FT-IRIS and trichrome staining. (a) FT-IRIS mapping of collagen deposition in a typical sample ( area) and the corresponding binary image separating collagen from the rest of the myocardium. (b) Trichrome staining of the sample tissue with the corresponding binary image. (c) Percentage area of collagen deposition in tissue sections (number of pixels) from the two methods in a Pearson correlation model. (, ).

