Fig. 4.
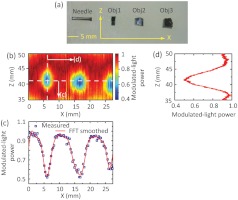
(a) Photograph of the cross-section of the 6 cm-thick phantom at the central plane () showing three embedded absorption objects. The needle is used as an ultrasonic fiducial marker for the alignment of the and positions between the embedded objects and the ultrasound focus. (b) UOT image at the central plane. The color bar corresponds to the modulated-light power normalized to the peak of each A-line. (c) Modulated-light power distribution along the horizontal dashed line in (b). The blue squares are the measured data, and the red curve the FFT smoothed results. (d) Modulated-light power distribution along the vertical dashed line in (b).

