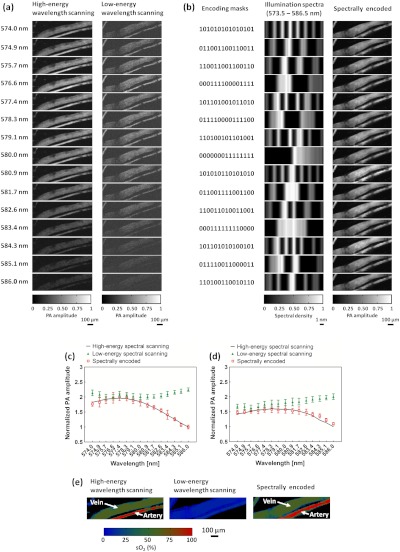
Fig. 3.
(a) PA image stack of the blood vessels in a mouse ear acquired by high-energy wavelength scanning, low-energy wavelength scanning, and spectrally encoded PA microscopy. (b) DMD-encoding masks, corresponding illumination spectra and PA image stack of the blood vessels in a mouse ear acquired by spectrally encoded PA microscopy. (c) Blood absorption spectra in the thin vessel (artery). (d) Blood absorption spectra in the thin vessel (vein). (e) Comparison of images acquired by high-energy wavelength scanning, low-energy wavelength scanning, and spectrally encoded PA microscopy.

