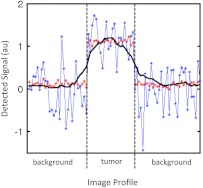
Fig. 2.
Two theoretical signal profiles of an image composed of background tissue and a tumor are displayed. Both profiles demonstrated a contrast of 1 or a contrast-to-background ratio of 11, but owing to large differences in noise characteristics, the location of the tumor is much easier to see in the red profile with a contrast-to-noise ratio (CNR) of 16.0 than in the blue profile with a CNR of 1.6. A CNR profile from the dual-reporter image displayed in Fig. 5(f) is also presented as a solid black line for comparison.

