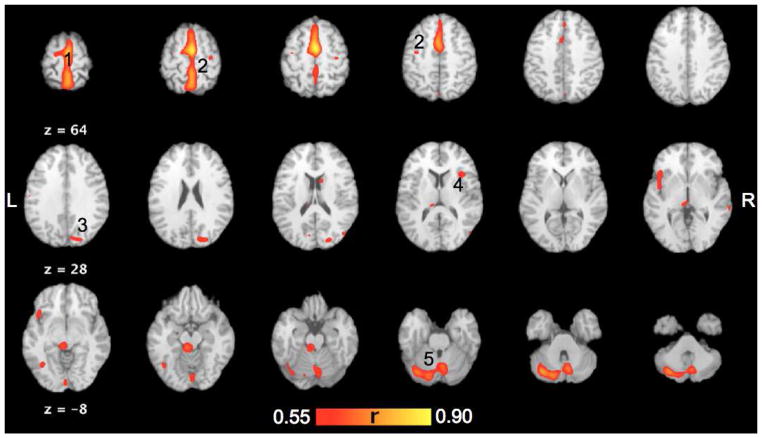
Figure 3.
Brain regions co-varying with right SMA as determined by task independent method TMS/PET (FDR corrected p<0.009). Medial (1) and lateral (2) motor areas in the frontal lobe, right parietal cortex (3), right insula (4) and cerebellum (5) showed covariance with R-SMA. The images are in Talairach coordinates.

