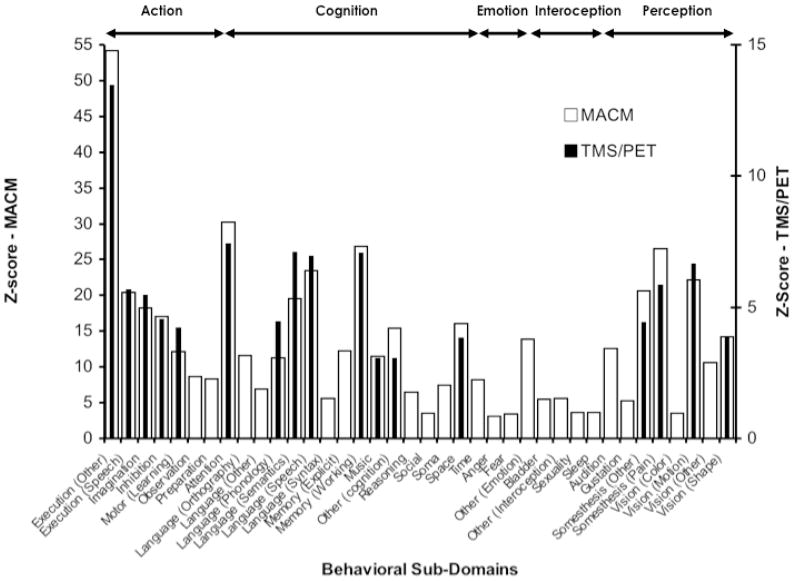
Figure 6.
Behavioral profile analysis of MACM (white bars) and TMS/PET (black bars) connectivity maps. The y-axis represents the z-scores (>3, corrected) of the sub domains for MACM analysis (left axis) and TMS/PET (right axis). Brain areas in the MACM map are represented in several behavioral sub-domains that spanned across action, cognition, emotion, interoception, and perception. The behavioral domains represented in the TMS/PET map are limited to few sub-domains in action, cognition, and perception.

