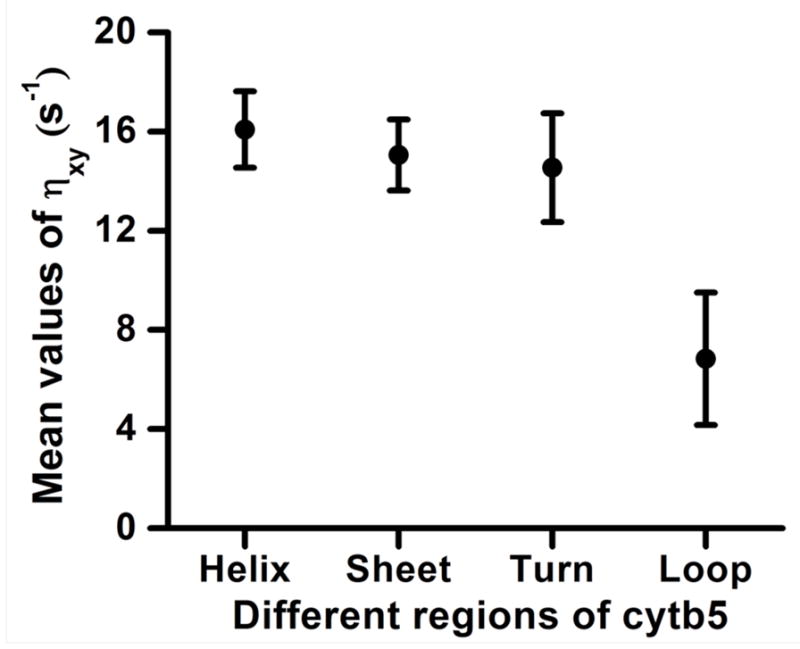
Figure 5. Distribution of backbone amide-15N transverse cross-correlation rates in different regions of a membrane-bound cytb5.

The mean values of transverse cross-correlation rates are plotted against different regions of a membrane-bound protein cytb5. Error bars correspond to the standard deviation. The mean values of transverse cross-correlation rates for helix, sheet, turn and loop-region (termini along with linker region) are 16.08, 15.05, 14.54 and 6.83 s−1 with standard deviations of 1.54, 1.43, 2.19 and 2.67 s−1, respectively.
