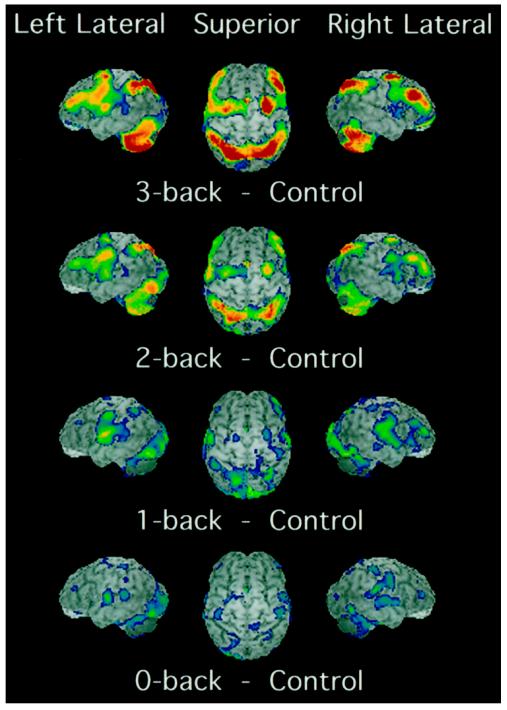
Figure 3.
PET activations for the four memory tasks in the 0-, 1-, 2-, 3-back experiment (20). In addition to the memory conditions, the experiment included a baseline condition, in which letters were presented in sequence and subjects pressed a key when a letter appeared. This baseline was subtracted from each memory condition to produce the images displayed. Shown are left and right lateral views as well as a superior view. The PET activations, shown in color, are superimposed on a surface rendering of a brain created from a standard MRI image. The color scale representing activations ranges from blue (lowest) to red (highest). The scale reflects the activation’s significance, with t values ranging from 1.65 to 7.00, with values above 7.00 displayed at the peak red color. Adapted from Smith and Jonides (21).

