FIGURE 2.
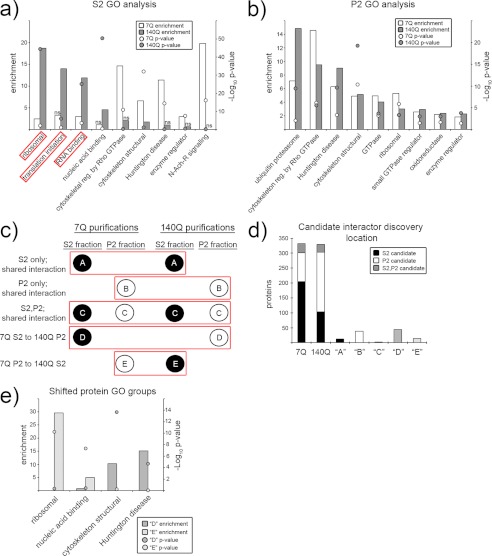
Functional categories of 7Q and 140Q interacting proteins. a and b, shown is a Gene Ontology analysis of S2 (a) and P2 (b) 7Q- and 140Q-associated proteins. The x axis labels individual molecular function or pathway categories as annotated by the PANTHER data base. The left y axis marks the enrichment (observed/expected), and right y axis marks the −log10 of the p value. Enrichment values are presented as bar graphs (7Q = white, 140Q = gray), and p values are presented as balls. ns, not significant (p > 0.05). c, a schematic shows different types of shared interactions between 7Q and 140Q. Balls represent individual protein categories (black = S2 identification, white = P2 identification). The red boxes group interaction types, which are labeled to the left of the schematic and given letter notations (A, B, C, D, and E within protein balls). d, the bar graph illustrates how 7Q and 140Q candidate interacting proteins were distributed between 7Q and 140Q purifications with letter notations summarizing shared interaction distributions as diagrammed in c. e, procedures were the same as in a and b except for the proteins grouped as D or E. N-Ach-R, nicotinic acetylcholine receptor.

