FIGURE 3.
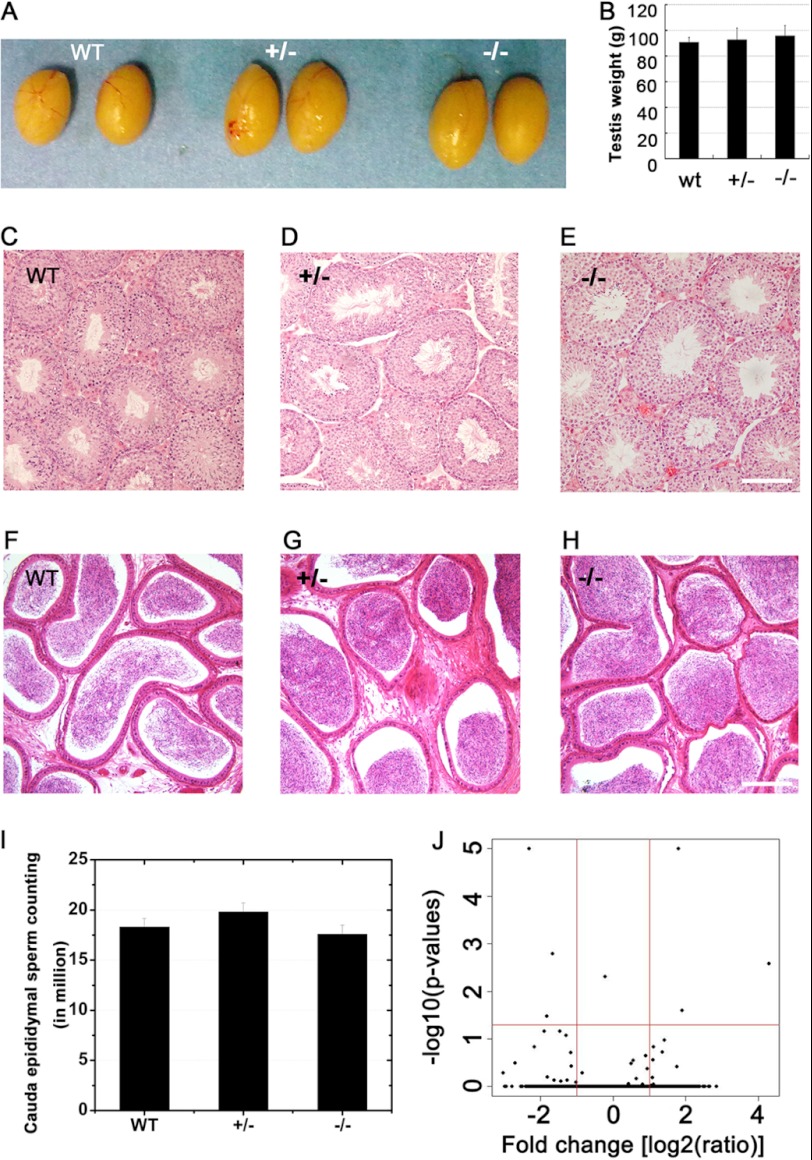
Lack of testicular phenotype in miR-449−/− mice. A, gross morphology of testes from adult male WT, miR-449+/−, and miR-449−/− mice. B, average testicular weight of adult WT, miR-449+/−, and miR-449−/− mice. C–E, hematoxylin-eosin-stained testicular sections of WT (C), miR-449+/− (D), and miR-449−/− (E) mice. Scale bar, 70 μm. F–H, hematoxylin-eosin-stained cauda epididymal sections of WT (C), miR-449+/− (D), and miR-449−/− (E) mice. Scale bar, 100 μm. I, cauda epididymal sperm counts in WT, miR-449+/−, and miR-449−/− male mice. Data are represented as mean ± S.E. (n = 3). J, volcano plot showing differentially expressed mRNAs between miR-449 KO and wild type testes determined by Illumina microarray analyses. The x axis represents -fold changes (KO versus WT) in log2 scale (red vertical line marks the 2-fold change). The y axis shows p value significance for each gene-specific analysis of variance in the −log10 scale (red horizontal line means p = 0.05). Only six genes (Cyp2c55, Gbf1, Itgad, Pbx4, Plk1, and Vav2) can be considered as significantly deregulated between KO and WT (fold change >2; p < 0.05). Data are represented as mean ± S.E. (n = 3).

