FIGURE 4.
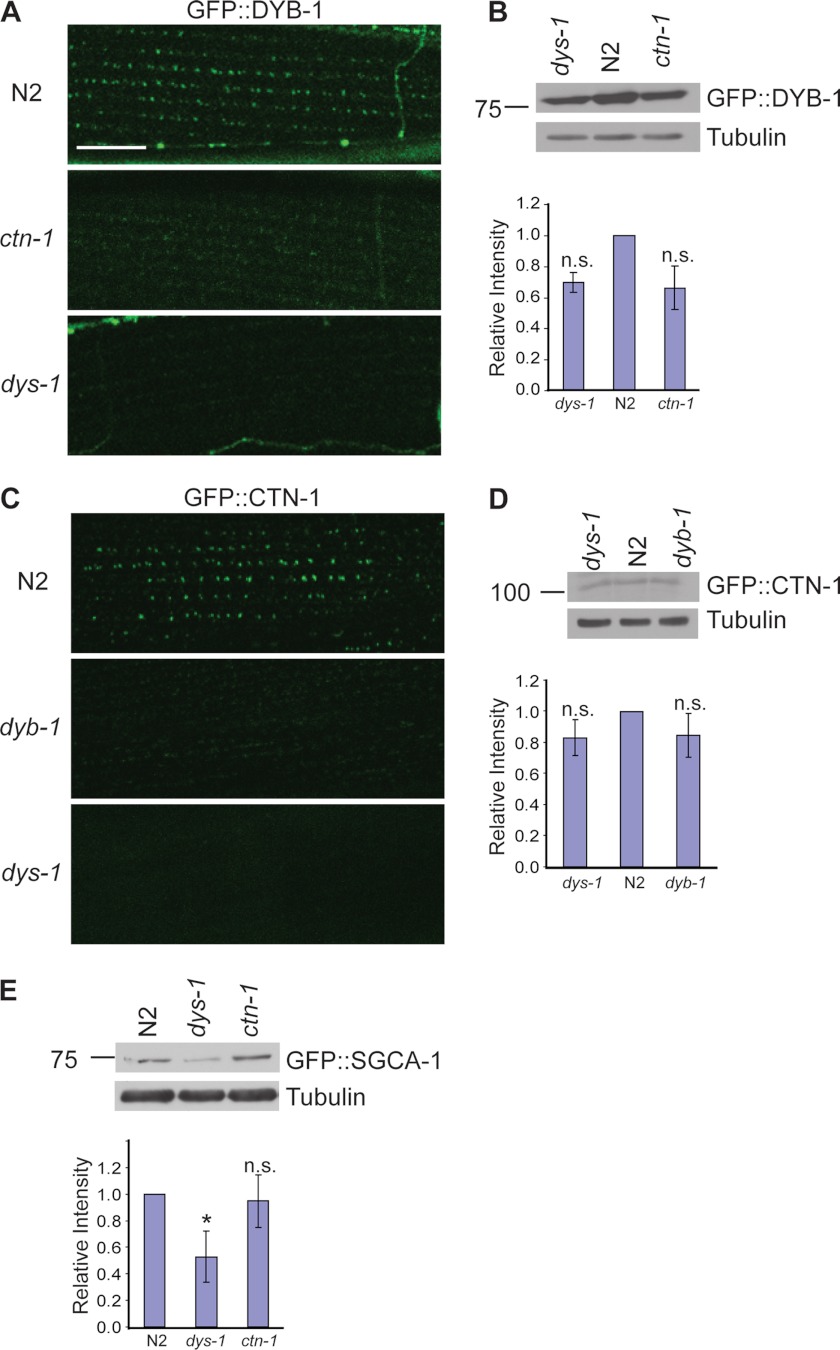
Proper localizations of both α-dystrobrevin and α-catulin in muscle are interdependent. A, C. elegans transgenic animals expressing integrated GFP-tagged DYB-1 under the control of the dyb-1 promoter were examined under a confocal microscope. DYB-1::GFP exhibits a distinctive punctate pattern in wild-type animals. However, this pattern is lost in both ctn-1(eg1167) and dys-1(eg33) mutant animals. Scale bar is 10 μm. B, protein levels of DYB-1::GFP in both ctn-1(eg1167) and dys-1(eg33) mutants are not significantly changed when examined by Western blot analysis using anti-GFP antibodies. Upper, representative immunoblot. Lower, quantification of relative band intensity normalized to the level of tubulin. Error bars, S.D. The change of the relative level was not significant (two-tailed Student's t test, p > 0.05). C, C. elegans transgenic animals expressing integrated GFP-tagged CTN-1 under the control of the ctn-1 promoter were examined under a confocal microscope. In wild-type animals, CTN-1::GFP exhibits a punctate pattern similar to that of DYB-1::GFP. This pattern is lost in both dyb-1(cx36) and dys-1(eg33) mutant animals. D, protein levels of CTN-1::GFP in both dyb-1(cx36) and dys-1(eg33) mutants are only slightly decreased compared with wild type when examined by Western blot analysis using anti-GFP antibodies. Upper, representative immunoblot. Lower, quantification of the relative band intensity normalized to the level of tubulin. Error bars, S.D. The change of the relative level was not significant (two-tailed Student's t test, p > 0.05). E, protein levels of SGCA-1::GFP were compared in wild-type, dys-1(eg33), and ctn-1(eg1167) animals by Western blot analysis. Compared with wild-type and ctn-1(eg1167) animals, dys-1(eg33) mutants show a significant decrease in SGCA-1::GFP expression. Upper, representative immunoblot. Lower, quantification of the relative band intensity normalized to the level of tubulin. Error bars, S.D. *, p < 0.05 (two-tailed Student's t test).

