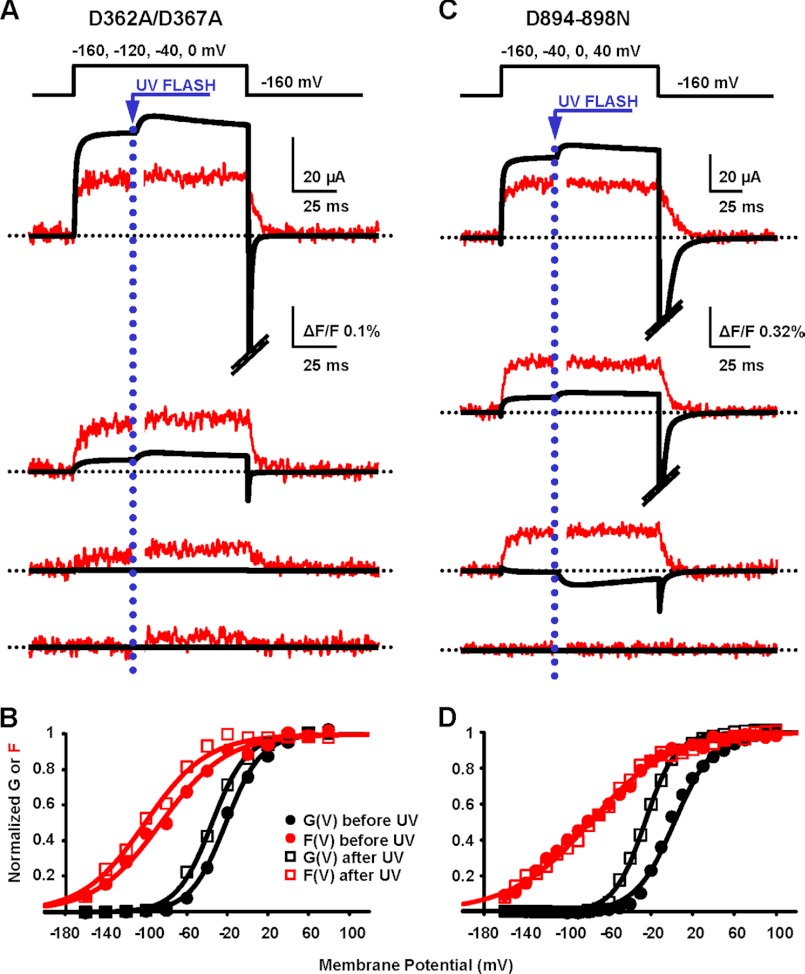
FIGURE 3.
RCK1 and RCK2 are not functionally equivalent Ca2+ sensors. A, K+ current and fluorescence traces simultaneously recorded during depolarizations to the indicated potentials from a representative oocyte expressing BK channels with neutralized high affinity Ca2+ sensing in RCK1 (D362A/D367A) are shown superimposed. Caged Ca2+ release was triggered 35 ms after the onset of depolarization by challenging the oocyte with UV light to produce [Ca2+]i increase from 137 to 320 μm. As in the pWT channels, ionic current and fluorescence increased following UV flash. The photodiode amplifier was blanked for 3 ms during the UV flash to prevent overload. B, normalized fluorescence (F) and K+ conductance (G) data from the experiment in A, before and after UV flashes, were fit to a single Boltzmann distribution. Both curves were leftward-shifted at high [Ca2+]i: before UV, GVhalf = −21 mV and FVhalf = −85 mV; after UV, GVhalf = −35 mV and FVhalf = −101 mV. C, as in A, from an oocyte expressing BK channels with neutralized calcium bowl in RCK2 (D894N/D895N/D896N/D897N/D898N, D894–898N). Following UV flash, [Ca2+]i increased from 105 to 210 μm. Only ionic currents were affected by Ca2+ uncaging. D, as in B, for data from calcium bowl mutant in C. Before UV, GVhalf = 3 mV and FVhalf = −79 mV; after UV, GVhalf = −26 mV and FVhalf = −78 mV.

