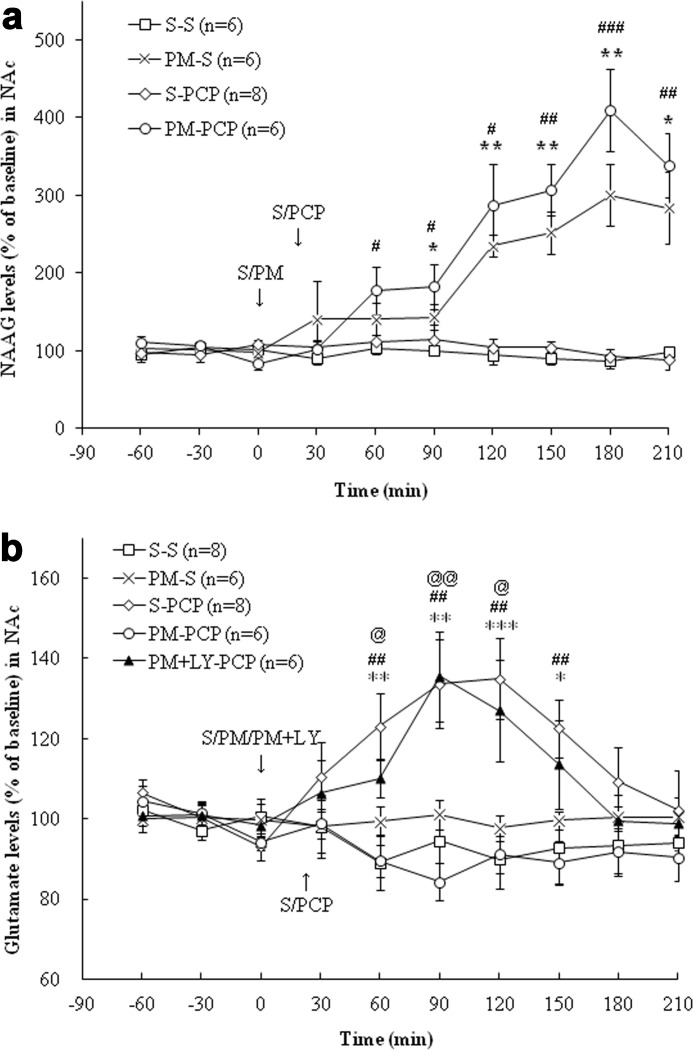
FIGURE 5.
a, effects of (first treatment) saline (S) or 2-PMPA (PM; 50 mg/kg, i.p.) and (second treatment) saline or PCP (5 mg/kg, i.p.) on NAAG levels in the NAc. S-PCP had no effect on extracellular NAAG levels in the NAc compared with the S-S treatment group (p = 0.71). The 2-PMPA significantly increased NAAG levels (versus S-S group, p < 0.001), as did the PM-PCP treatment. The S-S and S-PCP data are the same as presented in Fig. 3a. (p < 0.001). *, p < 0.05; **, p < 0.01, S-S versus PM-S. #, p < 0.05; ##, p < 0.01, PM-PCP versus S-PCP. b, effects of (first treatment) saline (S), 2-PMPA (PM; 50 mg/kg, i.p.), or 2-PMPA with LY341495 (LY; 1 mg/kg, i.p.) and (second treatment) saline or PCP (5 mg/kg, i.p.) on glutamate levels in the NAc. S-PCP induced a significant glutamate increase compared with the S-S treatment group (p < 0.001), whereas PM-S had no effect on glutamate levels (p = 0.37). 2-PMPA pretreatment significantly inhibited PCP-induced glutamate release (p < 0.001). LY431495 blocked the effect of 2-PMPA-induced glutamate release (PM-PCP versus PM + LY + PCP, p < 0.01). The S-S and S-PCP are the same as presented in Fig. 3b. *, p < 0.05; **, p < 0.01; ***, p < 0.001, S-S versus S-PCP. ##, p < 0.01, PM-PCP versus S-PCP. @, p < 0.05; @@, p < 0.01, PM-LY-PCP versus PM-PCP.

