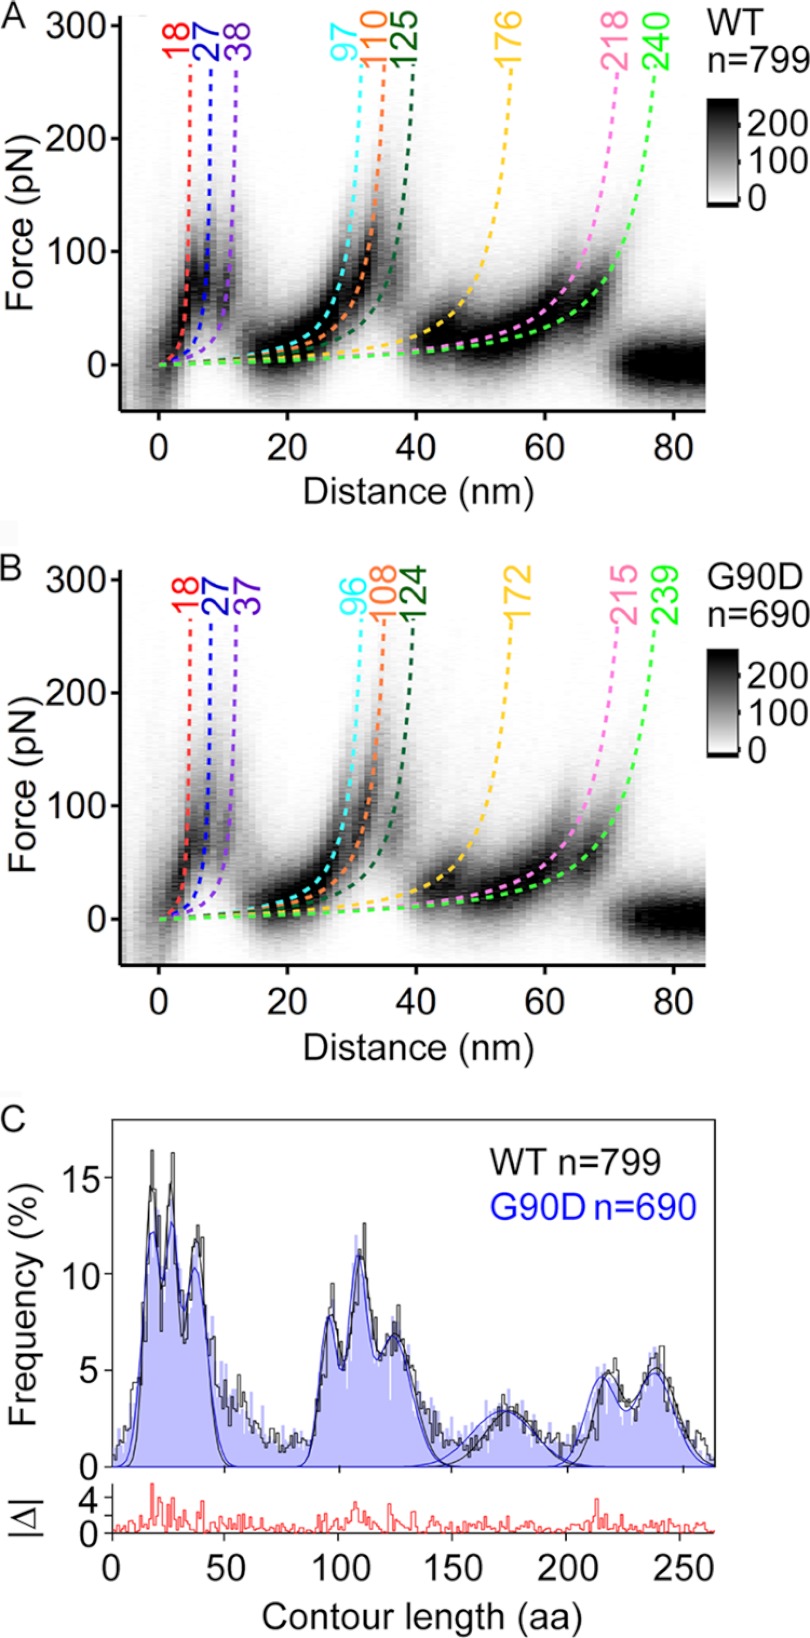
FIGURE 3.
Density maps of F-D curves and histogram of force peak positions. A and B, density maps generated from superimposition of all F-D curves collected for wild-type (A) and G90D mutant (B) rhodopsin. 799 F-D curves were superimposed for wild-type rhodopsin, and 690 F-D curves were superimposed for G90D rhodopsin. F-D curves were recorded at pulling velocities of 300, 700, 1500, 3000, 4500, and 6000 nm/s. The monochrome scale bars indicate relative intensities for each data set. Each force peak has been fitted with the wormlike chain (WLC) model (dashed curves) to reveal the contour length (in amino acids) of the stretched and unfolded polypeptide. This allowed for the localization of the stepwise unfolding of structural segments. The coloring of the wormlike chain curves corresponds to the structural segments they represent in Fig. 4. C, histograms showing the frequency of detecting a force peak at a certain contour length. A bin size of 1 amino acid (aa) was used. Gaussian curves are fitted to localize the most probable force peak positions (Table 1). The absolute frequency difference between both histograms (|Δ|) is shown at the bottom.

