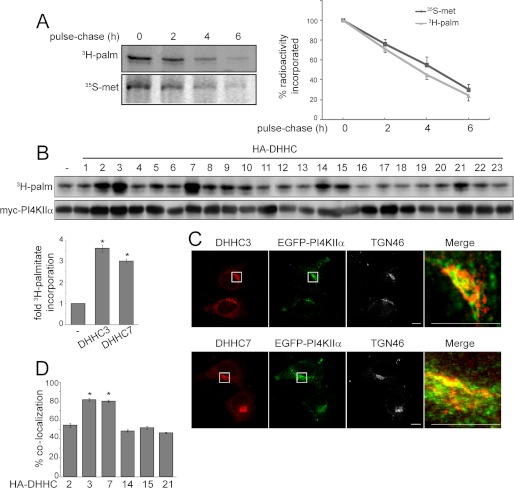
FIGURE 1.
PI4KIIα palmitoylation turnover and PAT screen. A, PI4KIIα protein and palmitate turnover. HEK293 cells were transfected with Myc-PI4KIIα. After metabolic labeling with [35S]Met/Cys for 1 h or [3H]palmitate (3H-palm) for 4 h, proteins were chased with unlabeled Met/Cys or palmitate for 2, 4, and 6 h. Cells were lysed and immunoprecipitated with anti-Myc antibody. The immunoprecipitated samples were then separated by SDS-PAGE and analyzed by fluorography. The fluorography intensities were quantified by ImageQuant 5.2 software and are expressed as radioactivity incorporation relative to the control at time 0. Values are means ± S.E. (n = 3). B, screening for potential PI4KIIα PATs. Individual HA-DHHC PAT cDNA clones were cotransfected with Myc-PI4KIIα into HEK293 cells. Cells were labeled with [3H]palmitate, and lysates were analyzed by SDS-PAGE, followed by fluorography. Lysates were subjected to immunoblotting with anti-Myc and anti-HA antibodies (shown in supplemental Fig. 1). The bar graph shows -fold increase in [3H]palmitate incorporation (adjusted for Myc-PI4KIIα protein levels) by coexpressed HA-DHHC3 or DHHC7 relative to the control value without expressed DHHC. Values are means ± S.E. (n = 3). *, p < 0.01. C, colocalization of endogenous DHHCs with EGFP-PI4KIIα. HeLa cells were transfected with EGFP-PI4KIIα and then labeled with anti-TGN46 and anti-DHHC3 or anti-DHHC7 antibodies to detect endogenous proteins. The boxed areas are enlarged in the merged images to compare the distribution of endogenous DHHC and EGFP-PI4KIIα. Scale bars = 10 μm. D, percentage colocalization of EGFP-PI4KIIα and HA-DHHC in HeLa cells. Z-stack confocal images were analyzed using the Zeiss LSM 510 ZEN software. Ten randomly chosen cells from each group were analyzed. Values are means ± S.E. *, p < 0.01.

