FIGURE 2.
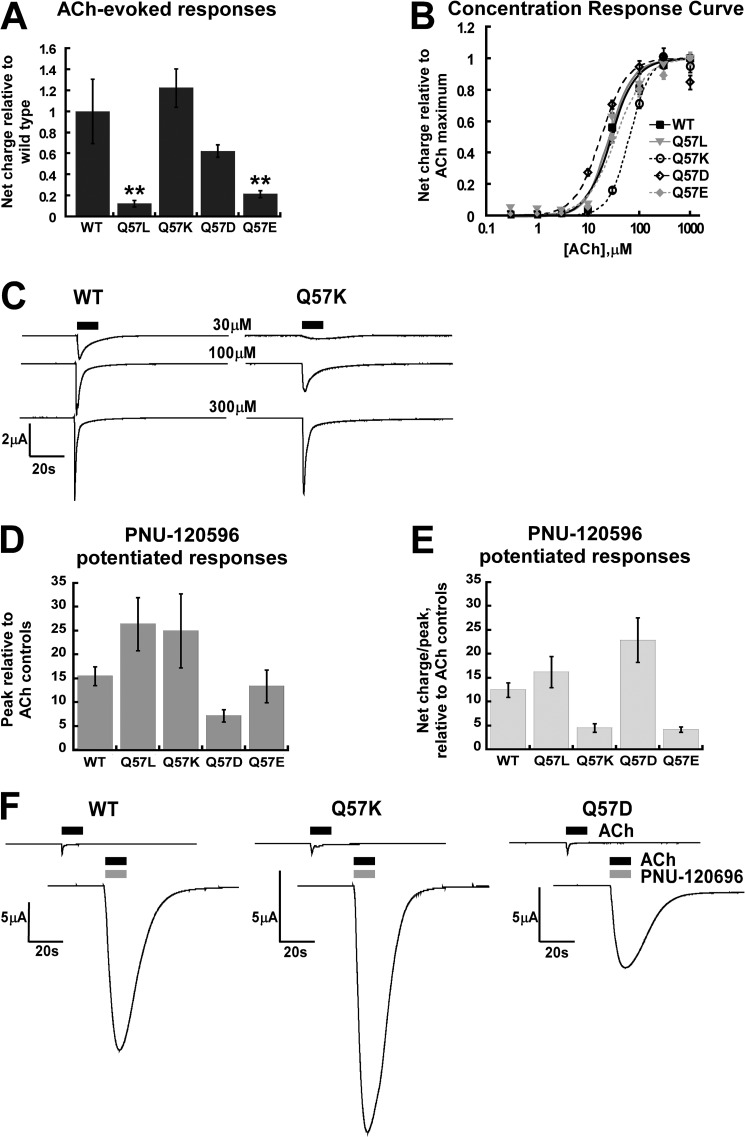
Functional tests of wild-type α7 Gln-57 mutants. A, comparison of the wild-type and Gln-57 mutant expression levels as estimated by the net charge response to ACh. All of the receptor types were tested 2 days after injection of RNA. The net charge responses of the 300 μm acetylcholine are normalized to that of the wild-type. **, p < 0.01; n ≥ 4. B, concentration-response curves of acetylcholine presented in net charge. C, representative traces of the acetylcholine activation on WT and Q57K mutant receptors at different concentrations. D and E, comparison of the PNU-120596-stimulated response when applied with ACh. Each oocyte received two initial 300 μm ACh controls followed by co-application of 300 μm acetylcholine and 300 μm PNU-120596. Both the peak response and the net charge response of the co-application were normalized to the average of the two initial controls. The peak responses of the co-application were displayed in panel D, and the ratio of the net charge response to the peak response of the co-application was displayed in panel E. F, traces for co-application of ACh and PNU-120596 to WT, Q57K, and Q57D receptors, with the accompanying ACh-only reference traces.

