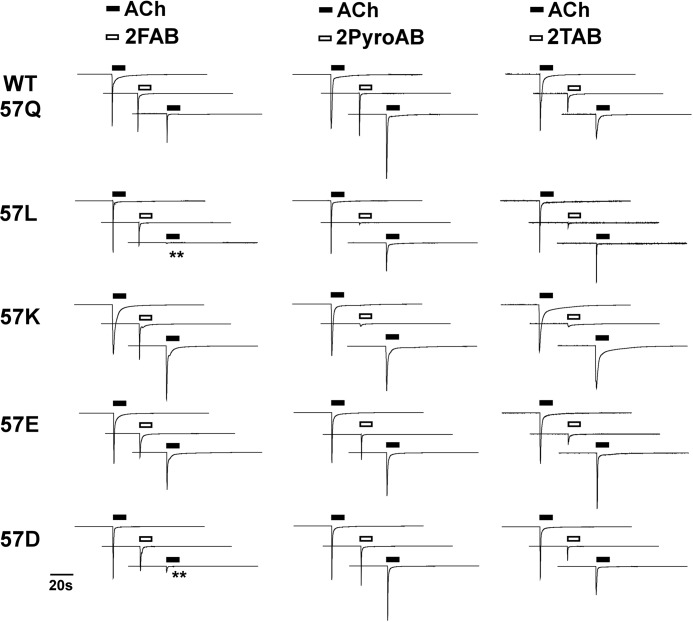
FIGURE 4.
Representative traces of the 300 μm arylidene anabaseine-evoked currents and their inhibition of the subsequent ACh-evoked responses of the wild-type α7 nAChR and Gln-57 mutants. Each oocyte received two 300 μm ACh controls (only the second one is displayed), a 300 μm arylidene anabaseine treatment, followed by another 300 μm ACh control. All of the traces are scaled to the pre-drug ACh control responses, the absolute peak values of which varied from 1.9 to 11 μA.

