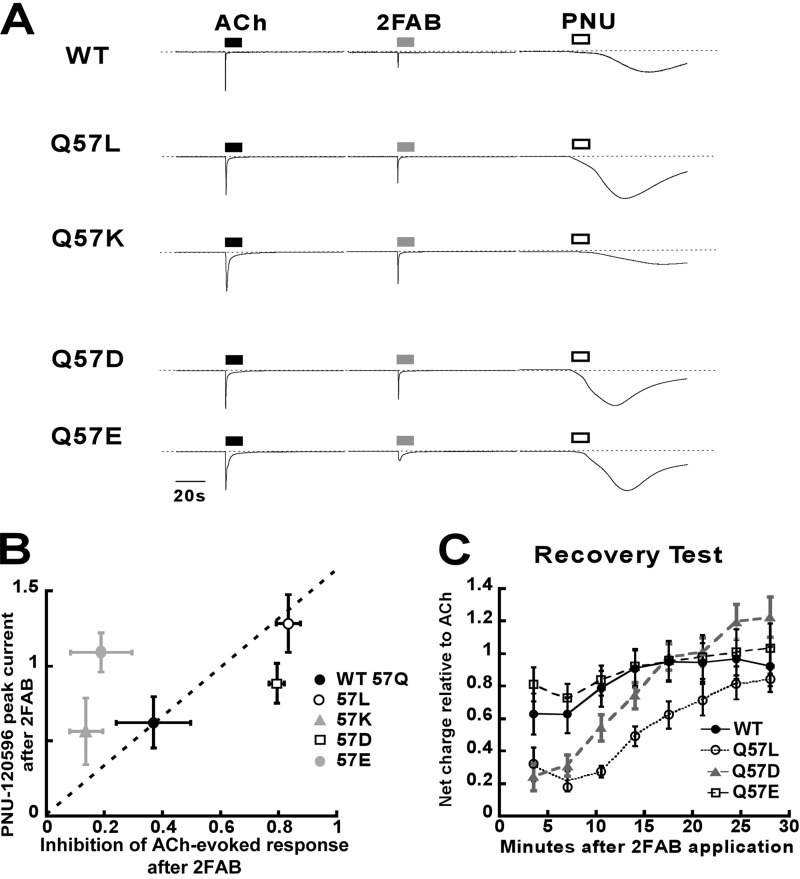
FIGURE 5.
A summary of the residual desensitization profile of 2FAB with WT and Gln-57 mutant α7 receptors probed by PNU-120596. A, representative traces of 300 μm PNU-120596-evoked responses following the application 300 μm 2FAB to induce RD. Also shown are 300 μm ACh control responses before the sequential applications of 2FAB and PNU-120596. All responses are scaled relative to the initial ACh control responses. B, scatter plot of the PNU-120596-evoked response in comparison with the inhibitory effect of 300 μm 2FAB on a subsequent ACh application (as shown in Fig. 4). The values of the inhibition effect are obtained from the recovery values displayed in Table 2. C, recovery tests of different α7 receptor types after 2FAB application. Cells were washed with Ringers solution after application of 2FAB, and repeatedly stimulated with 300 μm ACh to evaluate the rates of recovery. All responses plotted in panels B and C are the averages (±S.E.) of at least 4 oocytes.

