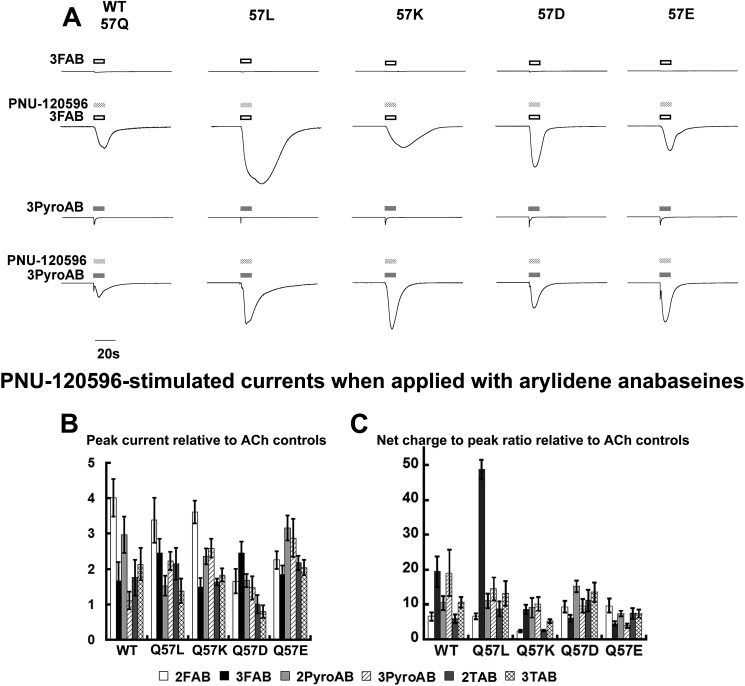
FIGURE 6.
Comparison of arylidene anabaseine-evoked current and currents evoked with the co-application of PNU-120596. A, representative traces for the application of 300 μm 3FAB (upper two traces) or 300 μm 3PyroAB (lower two traces) applied alone or co-applied with 300 μm PNU-120596. Each oocyte received two 300 μm ACh controls (only the first one was displayed in the representative traces), then was treated with one of the arylidene anabaseines at 300 μm, either with or without 300 μm PNU-120596. Each single trace displayed represents a single experiment, but all traces are normalized to its own ACh control, the absolute peak value of which varied from 0.6 to 10.2 μA. These control responses were scaled to the same level and omitted for clear presentation. B, the peak responses for co-applications of agonist and PNU-120596 relative to the average of the two initial ACh controls. C and D, the peak response (C) and net charge-to-peak response ratio (D) of the co-application responses relative to the average of the two initial controls. The ratios were calculated for each single cell. The mean ± S.E. were based on data obtained from at least four oocytes.

