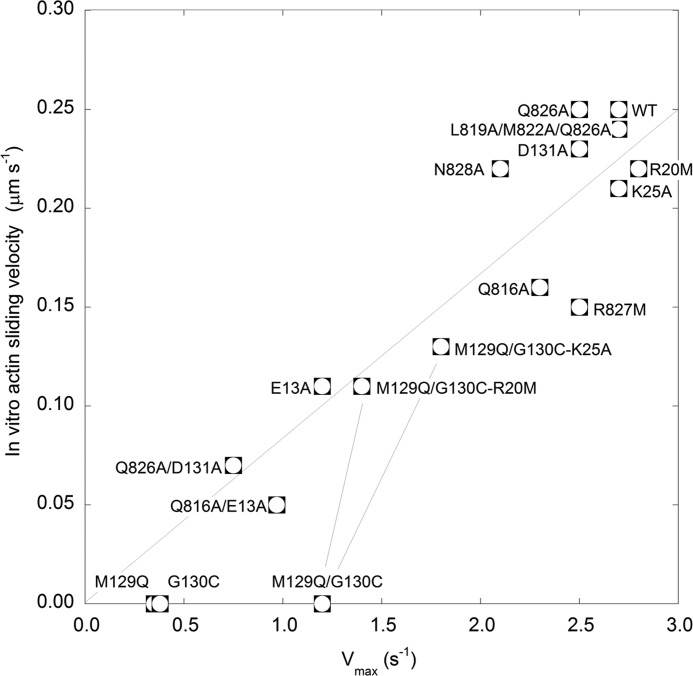
FIGURE 3.
Relationship between actin sliding velocity and Vmax for P-HMM constructs. Actin-sliding velocities and Vmax for P-HMM constructs are plotted with a line drawn between zero and the value for the WT construct. This line is not a fit to the data. The lines between the mutants M129Q/G130C and M129Q/G130C/R20M and M129Q/G130C/K25A merely highlight the partially recovered nature of the triple mutants with respect to both Vmax and motility. Data are from Table 1.

