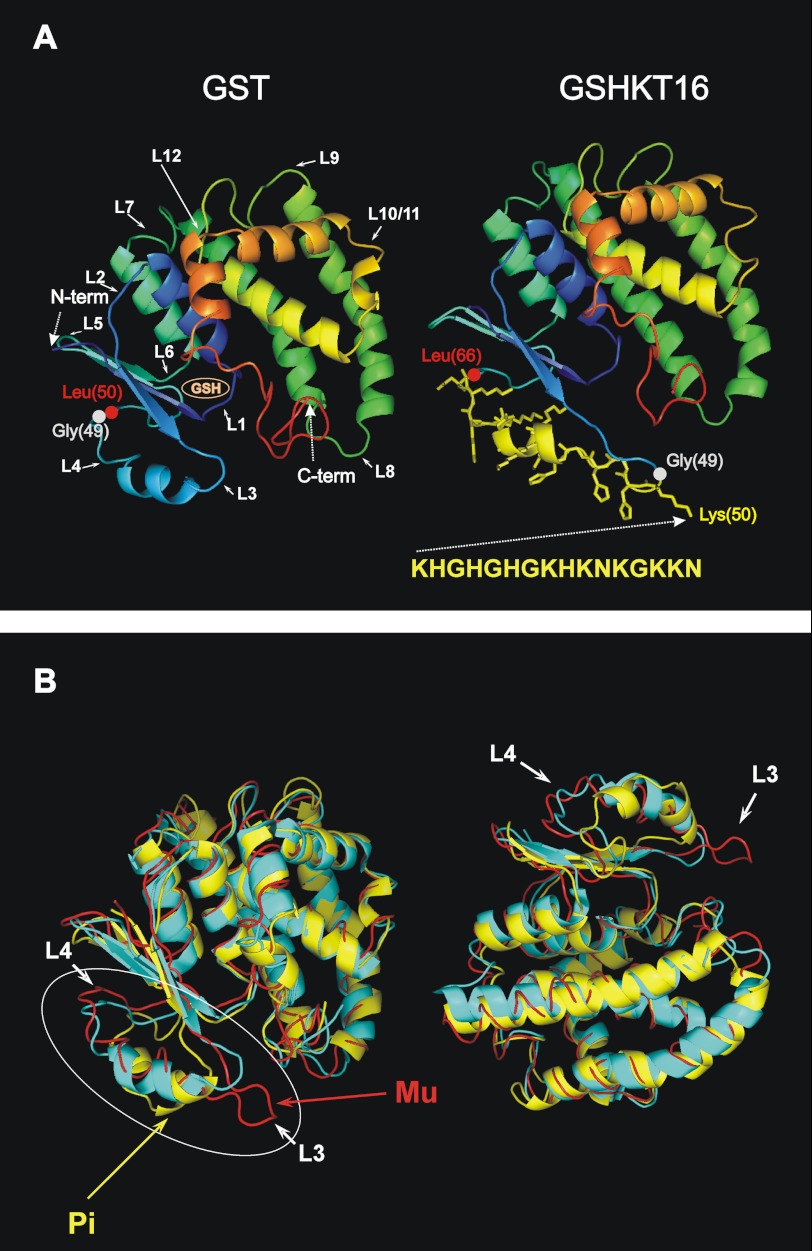
FIGURE 1.
Comparison of GSHKT16 and GST structures. A, left, three-dimensional structure of S. japonicum GST depicted as a ribbon diagram of the monomer based on the crystal structure (Protein Data Bank code 1M99). Major turn/loop regions are denoted with numbers. Domain I is shown in blue. Right, structural model of the GSHKT16 protein. The side chains of the inserted residues are shown in yellow. B, superimposed three-dimensional structures (ribbon diagrams) of S. japonicum GST (code 1M99; in cyan) and the human Pi class (code 10GS; in yellow) and Mu class (1HNA; in red) enzymes. The most flexible/variable region comprising loops 3 and 4 is circled.

