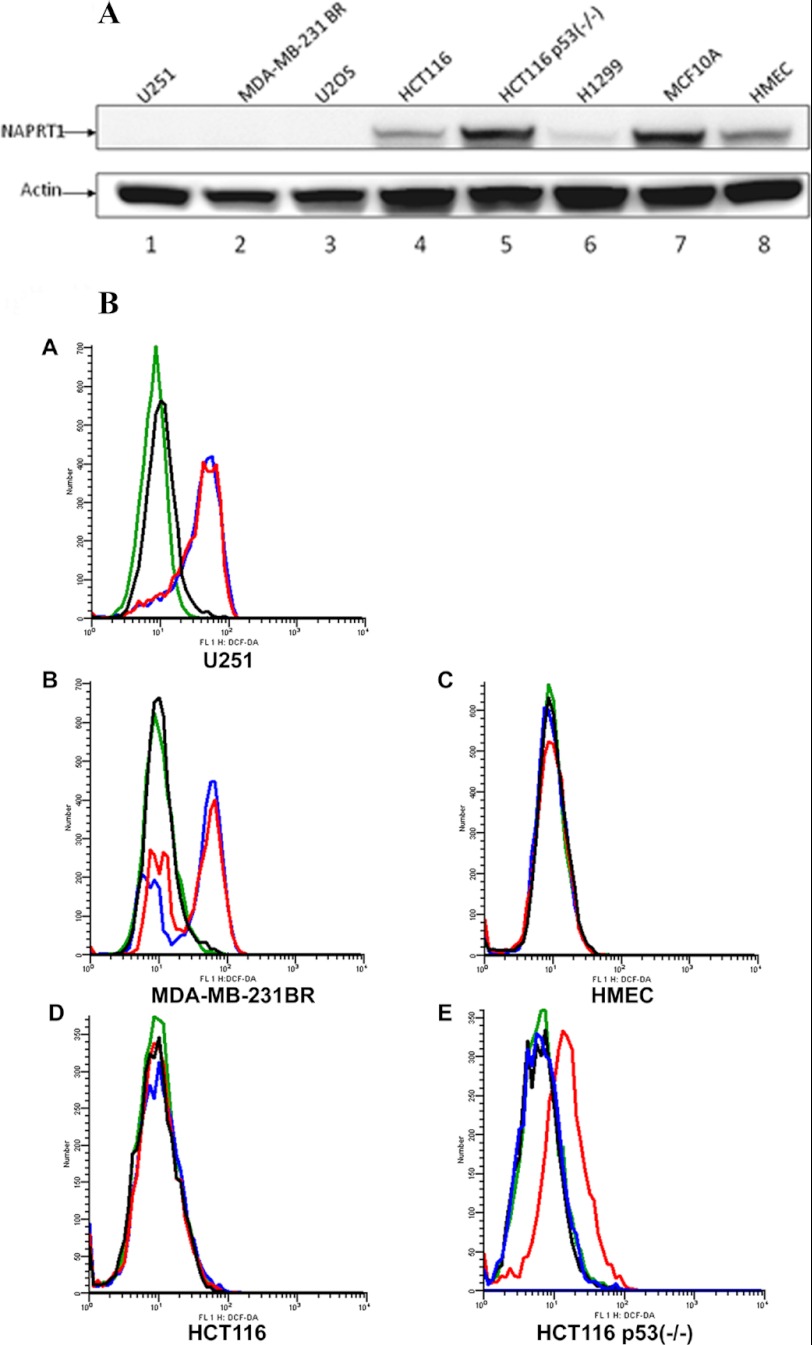
FIGURE 2.
A, various cell line lysates were probed for the expression of NAPRT1. Actin was used as a loading control. B, U251, MDA-MB-231BR, HCT116, HCT116 p53−/−, and normal HMEC DHE oxidation in the presence of GMX1778 at 5, 15, 5, 5, and 50 nm, respectively. Green histograms represent untreated cells; red indicates GMX1778-only treated cells; blue indicates GMX1778 with 20 μm niacin, and black indicates niacin only. One representative of three independent experiments is shown.

