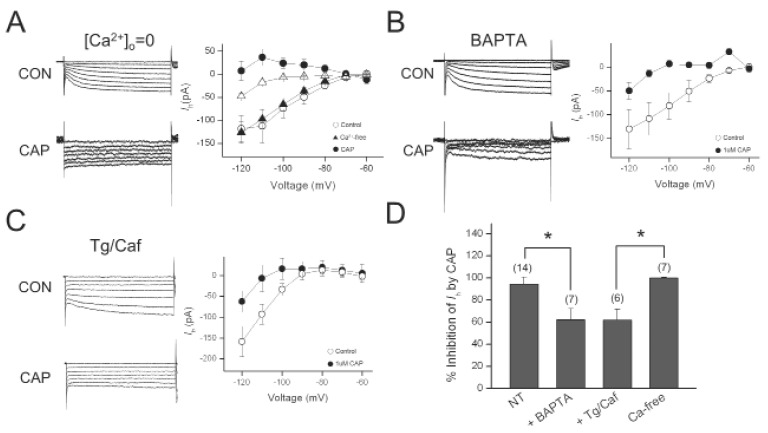
Fig. 4.
Effect of Ca2+ on Ih inhibition by capsaicin. (A) Representative current responses of DRG neurons to 1-s voltage pulses under control (CON) condition, during application of 1 µM capsaicin (CAP) in Ca2+-free bath solution (0 Ca2+). Graph shows the current-voltage relationship of Ih under control and during capsaicin application in Ca2+-free bath solution. (B) Representative current responses of DRG neurons to 1-s voltage pulses under control condition, during application of CAP in the presence of BAPTA in the pipette. Graph shows the current-voltage relationship of Ih under control and during capsaicin application in the presence of BAPTA. (C) Representative current responses of DRG neurons to 1-s voltage pulses under control condition, during application of 1 µMCAP after intracellular Ca2+ depletion bythapsigargin (Tg) and caffeine (Caf, 10 mM). Graph shows the current-voltage relationship of Ih under control and during capsaicin application after Tg/Caft retatment. (D) Bar graph summarizes % inhibitions induced by capsaicin. Values at the top of each bar represent the number of experiments. Bars represent the mean±S.E.M. Asterisks indicate a significant difference (*p<0.05).

