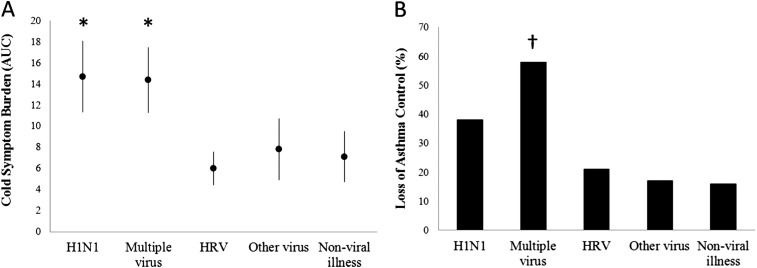
Figure 3.
Effects of viral etiology on (A) cold symptoms and (B) asthma control, based on episodes of infection. AUC = area under the curve; H1N1 = 2009 H1N1 influenza; HRV = human rhinoviruses. *P < 0.005 versus HRV, other virus, and nonviral illness; †P < 0.005 versus other virus and P < 0.001 versus HRV and nonviral illness.

