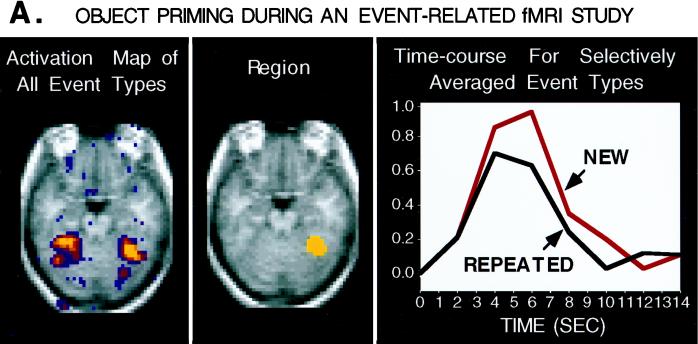
Figure 2.
A horizontal section shows averaged (n = 4) fMRI data for an object–classification task in which items were either new or repeated (primed). These activation maps are based on the t statistic and are derived from continuous runs of intermixed trials (mean intertrial interval = 8 s). Event-related fMRI techniques were used to make activation maps (61) and to remove the overlapping contributions of adjacent trials (60). The time course for a region of right extrastriate cortex (peak coordinate = 32, -48, -16) is shown for the new and repeated trials separately. Repeated items show a reduced level of activation relative to new items, suggesting a neural correlate of priming.

