
Figure 2. Postnatal deletion of Pten causes deficits in LTP and LTD.
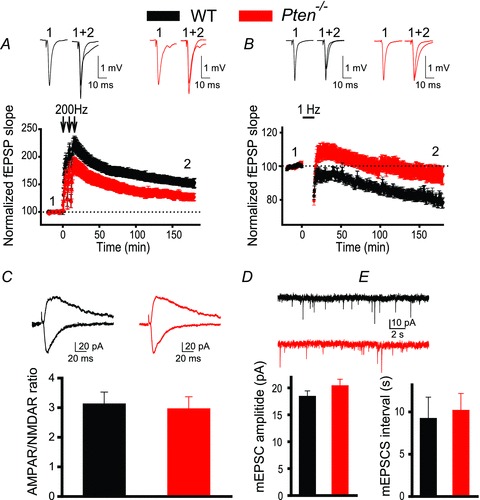
A and B, mean fEPSPs as a function of time before and after induction of LTP (A) or LTD (B) in slices from WT (black) or Pten−/− (red) mice. Insets show representative fEPSP traces before and 180 min after induction of synaptic plasticity. C, mean ratios of AMPAR/NMDAR currents recorded at CA3–CA1 synapses in slices from WT or Pten−/− mice are similar. Insets show representative traces of AMPAR-mediated (recorded at –70 mV, downward traces) and NMDAR-mediated (recorded at 40 mV, upward traces) EPSCs recorded in YFP− (WT) and YFP+ (Pten−/−) neurons. D and E, mean amplitudes (D) and intervals (E) of spontaneous mEPSCs measured in CA1 neurons of WT or Pten−/− mice are comparable. Insets show representative traces of mEPSCs measured in YFP− (WT) and YFP+ (Pten−/−) CA1 neurons.