
Figure 3. Postnatal Pten deletion in pyramidal neurons does not induce neuronal hypertrophy in the CA3 and CA1 areas of the hippocampus.
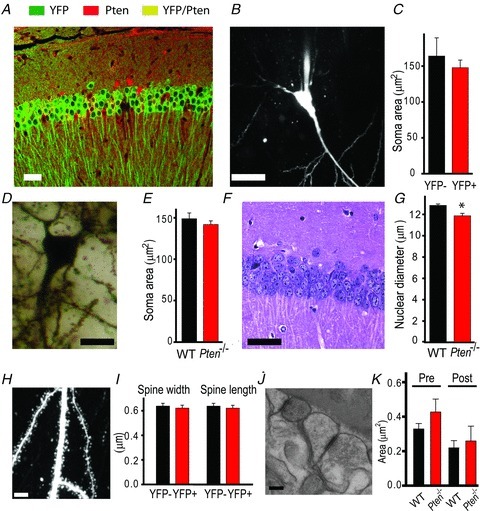
A, double-immunofluorescence staining for PTEN (red) and YFP (green) reveals that YFP is a reliable indicator of Pten deletion in Cre;Ptenfl/fl; R26LSL-EYFP mice, with only rare false-positive cells expressing both YFP and PTEN (yellow). B and C, TPLSM image of a neuron filled with Alexa 594 shows the soma clearly. This method was used to measure mean soma areas in WT (YFP−) or Pten-null (YFP+) neurons (C). D and E, Golgi staining of somata (D) of CA1 neurons was used to measure soma areas in slices from WT and Pten−/− mice (E). F and G, H&E staining of the CA1 area of the hippocampus shows the nuclei of cells. G, the mean nuclear diameter of neurons in H&E-stained slices from Pten−/− mice was smaller than that in WT mice (*P < 0.05). H, a two-photon image of an apical dendrite of a CA1 neuron. Note that the dendritic spines are clearly visible. These images were used to measure the mean width and length of dendritic spines in slices from WT and Pten−/− mice (I). J and K, scanning electron microscopic images of the hippocampus (J) were used to measure the mean presynaptic (Pre) and postsynaptic (Post) areas of synapses in the CA1 areas of WT and Pten−/− mice (K). Scale bars, 40 μm (A), 20 μm (B), 10 μm (D), 30 μm (F), 5 μm (H), and 100 nm (J).