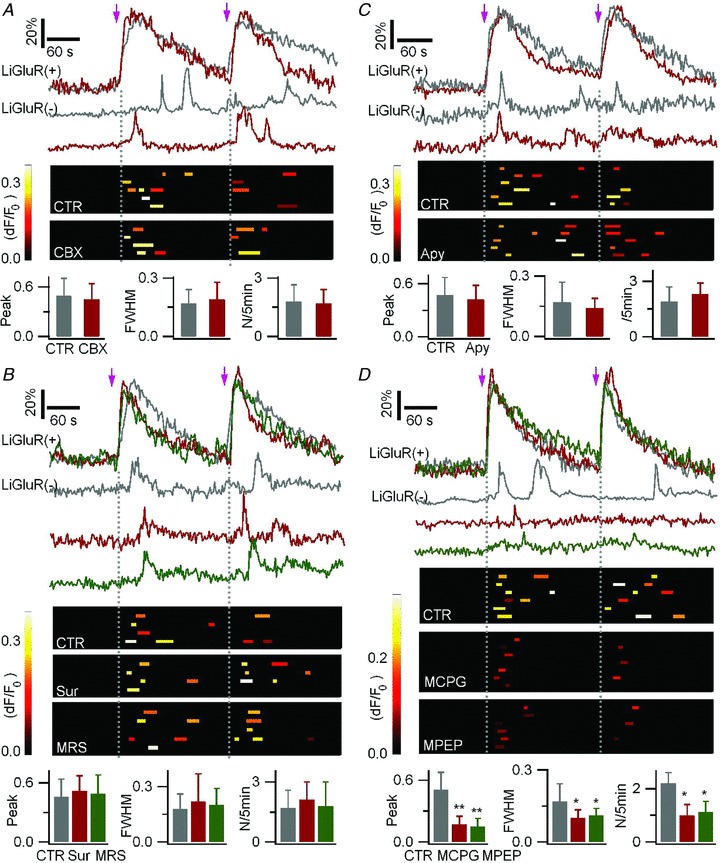
Figure 5. LiGluR-evoked astrocyte-to-astrocyte communication is mediated by glutamate release.

To monitor Ca2+ activity in LiGluR(+) and LiGluR(−) cells, astrocytes were co-transfected with LiGluR-RFP and AsRed, and loaded with Fluo-4 AM. A, the gap junction blocker carbenoxolone (CBX) had no effect on the LiGluR-evoked Ca2+ rises in LiGluR(−) astrocytes. Light pulses are indicated by arrows. Top, ΔF/F0 sample traces in a LiGluR(+) cells and an adjacent LiGluR(−) cells in control (CTR, grey traces) and in carbenoxolone (CBX, 100 μm, red traces). Middle, summary plots of the near-membrane Ca2+ rises detected in LiGluR(−) cells. Each row represents a single cell, each bar represents a single event (larger than 3SD of the background noise), its location on the x-axis reflects its timing, bar length reflects its half-duration (FWHM), and its peak amplitude (ΔF/F0) is encoded in pseudocolour. Bottom, summary data of the relative peak amplitude and FWHM, both normalized to the corresponding Ca2+ rises in LiGluR(+) cells, and the occurrence frequency (N/5 min) of the Ca2+ rises in LiGluR(−) astrocytes in CTR (12 events, 5 cells) and CBX (9 events, 4 cells; P > 0.6). B, top, sample traces in control (grey traces), in the presence of the P2 purinergic receptor antagonist suramin (Sur, 100 μm, red traces), and P2Y1 receptor antagonist MRS2179 (MRS, 25 μm, green traces). Middle, summary plots of the Ca2+ events in LiGluR(−) cells as defined in A. Bottom, summary data in control (n = 9 events, 4 cells), suramin (11 events, 4 cells), and MRS2179 (12 events, 5 cells; P > 0.23). C, apyrase (20 U ml−1) did not inhibit the LiGluR-evoked Ca2+ transients in the LiGluR(−) cells. Sample traces, and summary plots of the evoked Ca2+ transients in control (15 events, 6 cells), and in apyrase (Apy, n = 16 events, 5 cells; P > 0.26). D, LiGluR-evoked Ca2+ transients in the LiGluR(−) cells in control (n = 18 events, 6 cells; grey traces) were reduced in amplitude, duration, and frequency by the group I/II mGluR antagonist MCPG (500 μm, 9 events, 6 cells; red traces) and the mGluR5 antagonist MPEP (100 μm, 9 events, 7 cells; green traces).
