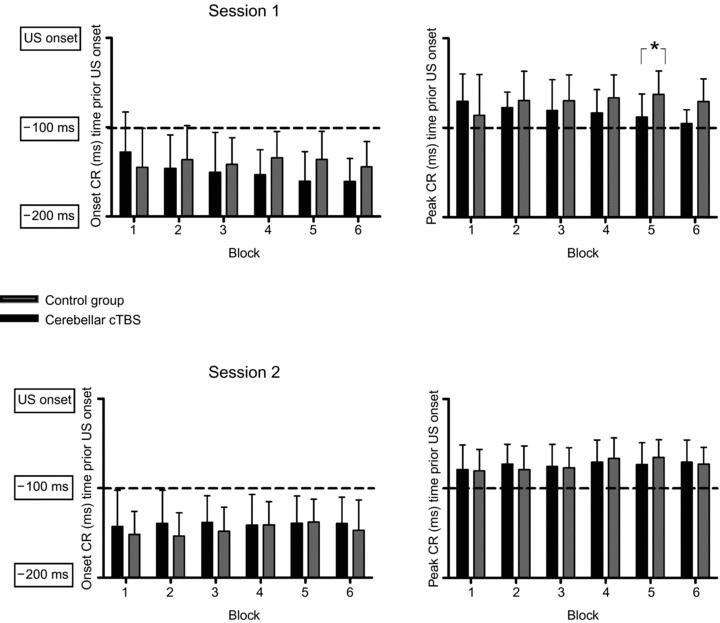
Figure 3. Onset and peak timing of conditioned responses (CR) are shown on the y axis.

Data for the two groups of participants are plotted for participants receiving cerebellar cTBS (black) and control group (grey) for both sessions. Error bars represent standard deviation. *Significant differences between groups (P < 0.05).
