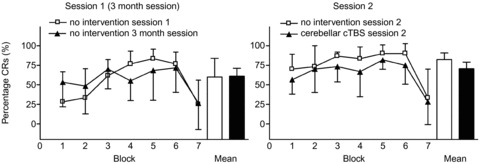
Figure 4. The percentages of conditioned responses in each block of testing (including block 7, the extinction block) are shown on the y axis.

The left side illustrates participants first session of EBCC (open squares) and their third session of EBCC performed at least 3 months following their last session of EBCC. On the right, data from a fourth session of EBCC before which participants received cTBS (filled triangles) and for comparison, data from their second session of EBCC given without cTBS in experiment 1 is illustrated (open squares). Mean percentage CR incidence over the six acquisition blocks is also shown to visualize overall performance. Error bars represent standard deviation.
