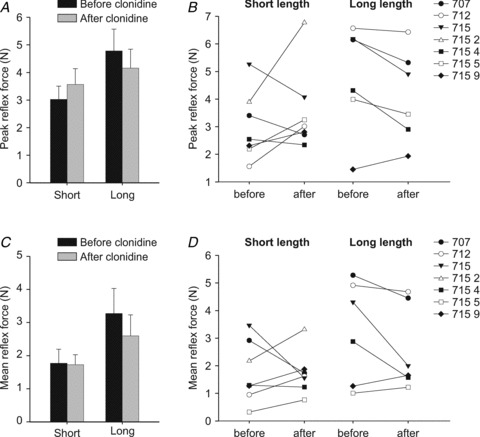
Figure 4. Group and individual data for triceps surae peak and mean reflex forces evoked by stretching triceps surae muscles in chronic spinal cats before and after clonidine injections.

A and C, group data for peak and mean reflex forces in the different conditions. Each bar is the mean ± the standard error of the mean in 6–7 cats in each condition. B and D, individual data for peak and mean reflex forces. Each data point is the mean of 2–5 stretch reflex trials before and after clonidine. Note that data for cat 7152 is available at the short length only due to stretch-evoked rhythmic activity at the long length.
