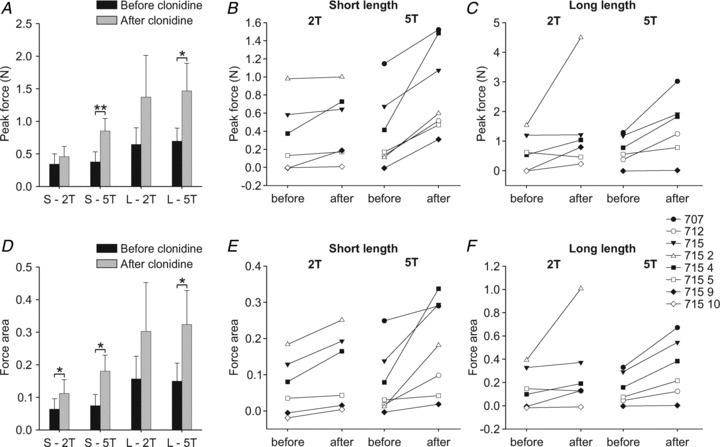
Figure 6. Group and individual data for peak force and force area during stimulation of the right Tib nerve in chronic spinal cats before and after clonidine injection.

A and D, group data for peak force and force area in the different conditions. Each bar is the mean ± the standard error of the mean of 6–7 cats in each condition. B and C, individual data for peak force and E and F, force area at short and long lengths at 2T and 5T. Each data point is the mean of 2–6 stimulation trials in each condition. *P≤ 0.05, **P ≤ 0.01.
