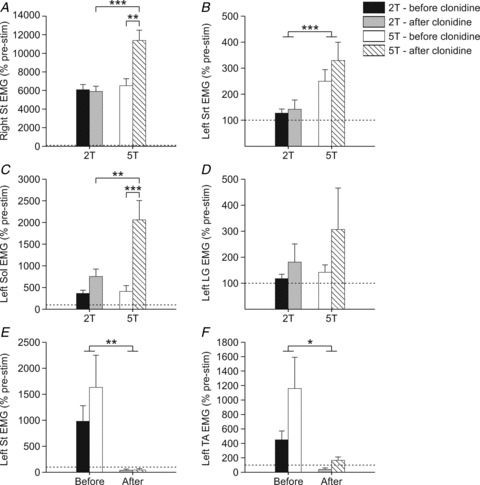
Figure 7. Muscle activity evoked during right tibial nerve stimulation across chronic spinal cats before and after clonidine injection.

EMG signals were rectified and smoothed with a 0.1 s time constant. The area under the rectified EMG curve (modulus area function in Spike2 v. 6.0) was measured between cursors j (stim onset) and k (stim offset) minus the area between cursors h and i (i.e. baseline EMG). The ratio of the EMG during stimulation as a function of baseline EMG was calculated and compared across conditions. B, E and F show significance of three-factor ANOVA (*P≤ 0.05), while A and C show significance of independent samples t tests P ≤ 0.05). Each bar is the mean ± standard error of the mean in each condition. Horizontal dashed lines are at the 100% mark as a reference. *P ≤ 0.05, **P ≤ 0.01, ***P ≤ 0.001.
