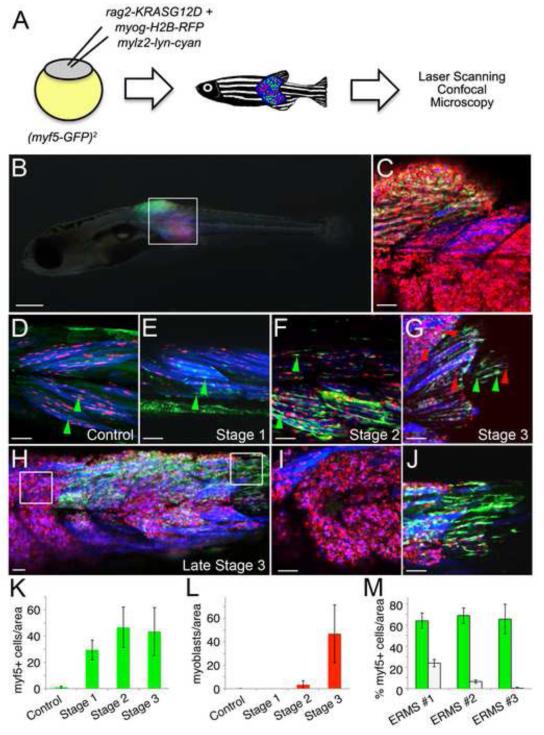
Figure 4. myf5-GFP+ ERMS-propagating cells are dynamically reorganized during tumor growth.
(A) Schematic of the experimental design.
(B) A myf5-GFP transgenic animal injected at the one-cell stage of life with rag2-KRASG12D, myogenin-H2B-RFP, and mylz2-lyn-cyan with triple fluorescent-labeled ERMS at 16 days of life.
(C) A merged confocal image of the boxed region shown in B.
(D) Control myf5-GFP transgenic animal injected with myogenin-H2B-RFP and mylz2-lyn-cyan. myf5-GFP+ muscle precursor cells are denoted by green arrowheads.
(E-G) Representative image of an ERMS-affected zebrafish labeled with myf5-GFP, myogenin-H2B-RFP and mylz2-lyn-cyan at stage 1, 2 and 3, respectively. Green arrowheads denote myf5-GFP+ cells whereas red arrowheads denote mononuclear myogenin-H2B-RFP+ ERMS cells.
(H) Late stage 3 ERMS from a triple fluorescent-labeled animal.
(I-J) Boxed regions in H imaged at higher magnification show regional partitioning of differentiated cells (I) compared with myf5-GFP+ ERMS-propagating cells (J).
(K) Quantification of myf5-GFP+ cells during stages of ERMS growth when compared to control animals.
(L) Quantification of mononuclear myogenin-H2B-RFP+ cells during stages of ERMS growth when compared to control animals.
(M) Quantification of regional compartmentalization of ERMS cells based on differentiation status in late stage 3 tumors (n=3). Green bars denote regions that contain higher percentages of myf5-GFP+ ERMS-propagating cells compared to white bars where myf5-GFP+ cells are less abundant and conversely more differentiated. Error bars in K-M +/− 1 STD. Scale bar is 500 μm (B) and 50 μm (C-J).
See also Figure S2.

