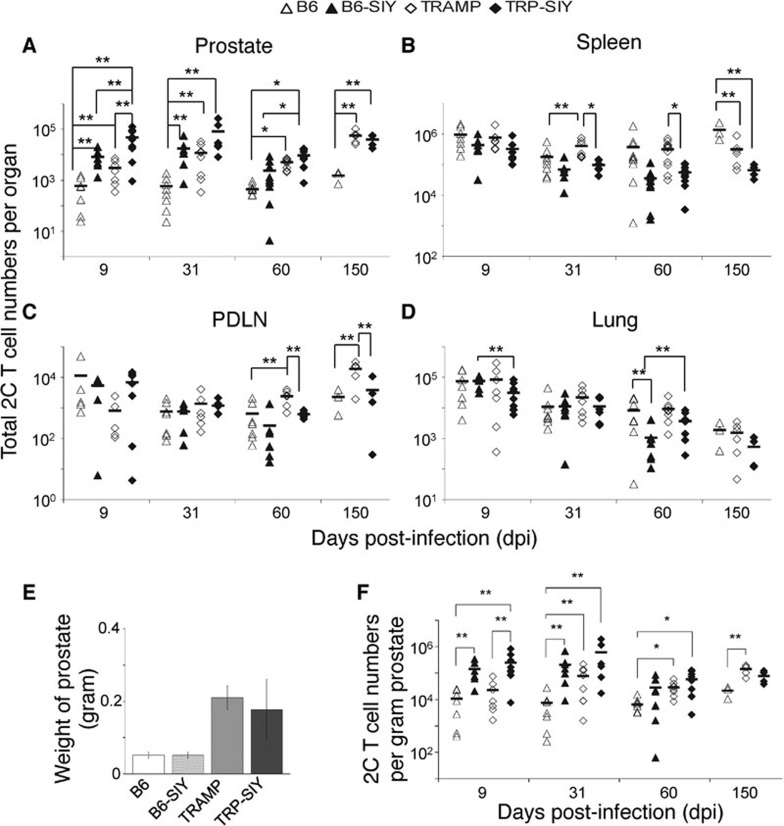
Figure 1.
Spatial and temporal distribution of 2C T cells. Naive 2C cells were transferred into B6, B6-SIY, TRAMP and TRP-SIY mice and infected with WSN-SIY virus. At the indicated dpi, single-cell suspensions were prepared from prostate, spleen, PDLN and lung. Cells were counted and assayed for the presence of 2C cells by staining with antibodies specific for 2C TCR and CD8 followed by flow cytometry. The 2C cell number in each tissue was calculated by multiplying the total cell numbers by the frequency of 2C (CD8+ and 2C TCR+) cells in the tissue. (a–d) The total 2C cell numbers in different tissues at the indicated dpi pooled from at least three separate experiments for each time point. (e) Comparison of average prostate weights of B6, B6-SIY, TRAMP and TRP-SIY mice between 5 and 7 months of age. The prostate lobes were dissected from the urogenital system and weighed. The error bars are standard deviations (n≥5–7 per group). (f) The number of 2C cells per gram of prostate. The number was calculated by normalizing the number of total 2C cells (from (a)) to the weight of the prostate for each type of mouse. Each symbol represents one mouse. The lines indicate the average 2C cell numbers (n=4–9 per group). *P<0.01, **P≤0.05 are indicated. B6, C57BL/6; dpi, days post-infection; PDLN, prostate draining lymph node; SIY, SIYRYYGL; TCR, T-cell receptor; TRAMP, TRansgenic Adenocarcinoma of the Mouse Prostate; TRP-SIY, TRAMP mice expressing SIY antigen in prostate tumor tissue; WSN-SIY, influenza A/WSN virus expressing the SIY epitope.

