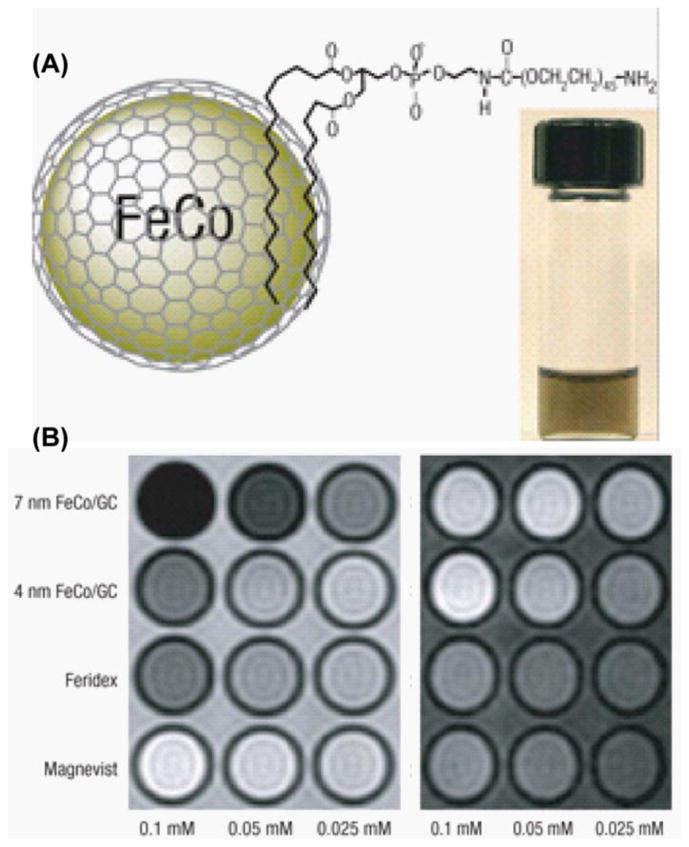
Figure 11.

(A) Schematic diagram of phospholipid stabilized FeCo/graphite shell nanocrystal and a PBS suspension after heating to 80 °C for 1 h (inset). (B) T2 (left) and T1 weighted MR images of various contrast agents at three metal concentrations [50].
