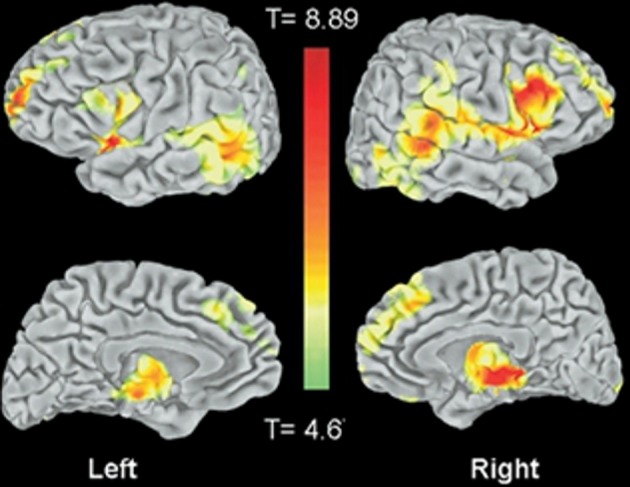
Figure 11.

From Honea et al. (2008) showing data from a large morphometric study using 169 patients with schizophrenia-spectrum disorders and 212 control subjects Statistical maps of the entire brain showing gray matter volume reductions in schizophrenics versus control subjects. Figure 1 panel A reprinted with permission from Honea et al. (2008). © 2008 Society of Biological Psychiatry.
