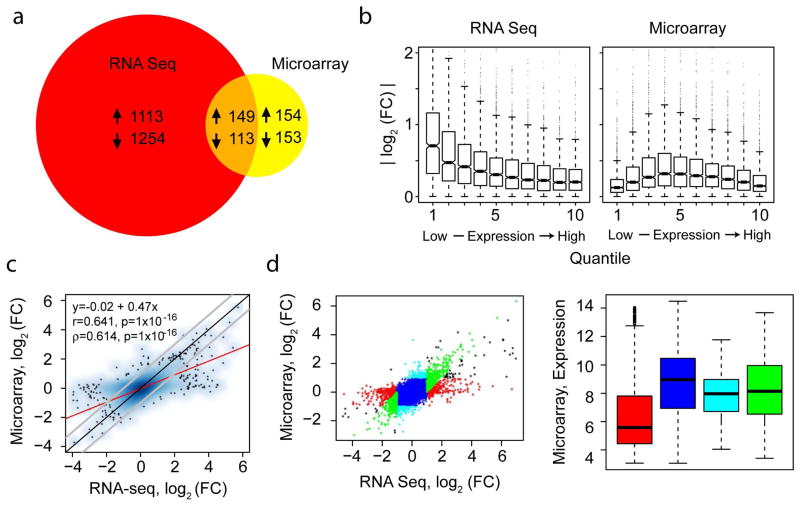
Figure 1. Identification of a large set of differentially expressed genes in psoriatic skin.
(a) Venn diagram comparing DEGs between lesional and non-lesional skin of psoriatic patients as assessed by RNA-seq and microarray analysis using the samples from the same set of patients. Indicated in the diagram are the numbers of upregulated and downregulated DEGs. (b) Boxplots (means, boxes 25–75%, +/− whiskers 95%) of the absolute values of the log2 fold change among ten quantiles of concentrations for RNA-seq (left panel) and microarray analyses (right panel). (c) Scatterplot of the FC values for all genes as estimated by RNA-seq and microarray analyses. (d) Genes were grouped based on dot plot location (left panel) and assessed for mean expression as determined by microarray analysis (right panel).

