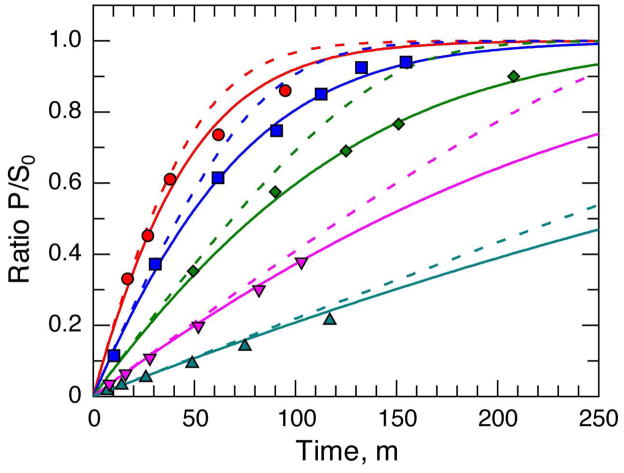
Fig. 1. Global fit to the data of Michaelis and Menten.
The data from Michaelis and Menten (reproduced in Table 1) were fit by simulation using KinTek Explorer software (9) with the only variable being kcat*E0 to get the smooth lines; an arbitrary, low enzyme concentration was chosen to perform the simulation. Data are for starting concentrations of sucrose of 20.8 (▴), 41.6 (▾), 83 (◆), 167 (■), and 333 (●) mM from Table 1. Data at times longer than 250 m were included in the fit but are not displayed in the figure. The dashed lines show the kinetics predicted if product inhibition is ignored.

