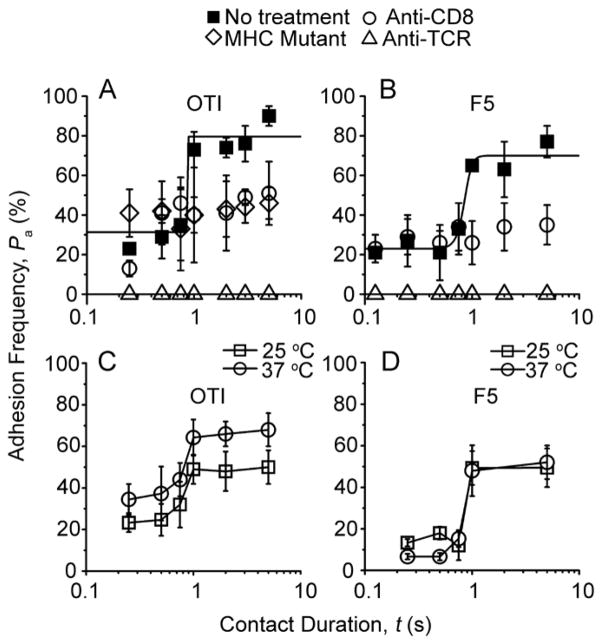
Figure 2. Two-stage kinetics of TCR-pMHC-CD8 trimolecular interaction.
A, B, Pa vs. t T1 (A) or F5 (B) T cells interacting with RBCs bearing 25 OVA:H-2Kb/μm2 (A) or 14 NP68:H-2Db/μm2 (B) in the absence (■) or presence of anti-CD8 (○) or anti-TCR (△) reagents. Also included in A are data for OT1 T cells interacting with RBCs bearing 25 OVA:H-2Kbα3A2/μm2 (◇). Curves are trend lines. C, D, Pa vs. t data of OT1 (C) or F5 (D) T cells interacting with RBCs bearing 12 OVA:H-2Kb/μm2 or 14 NP68:H-2Db/μm2, respectively, at 25 (□) or 37 (○) °C. Representative data (measured by the same method as that in Fig. 1) of three repeated experiments are shown. See also Figure S1.

