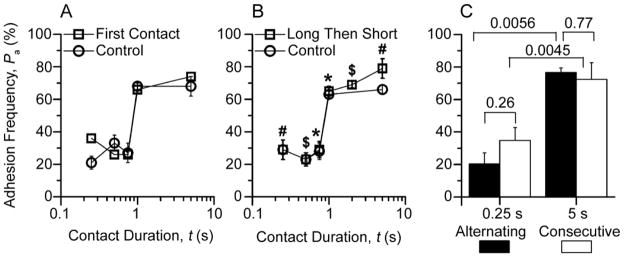
Figure 6. Second-stage binding does not need accumulation of TCR-CD8-pMHC trimolecular interaction and is reversible.
A, For each contact duration, 50 pairs of F5 T cells and NP68:H-2Db-coated RBCs (32 μm−2) were each contacted once to estimate Pa from percent adherent pairs (□) to compare with mean Pa ± s.e.m. measured using 3-4 pairs of cells from the same batch each repeatedly contacted 50 times (○). B, F5 T cells and NP68:H-2Db-coated RBCs (32 μm−2) were repeatedly contacted 50 times first to measure Pa at a long duration (≥1 s, indicated by different symbols) and then another 50 times to measure anther Pa at a short duration (≤0.75 s, indicated by matched symbols) (□) to compare with Pa measured using cells from the same batch but repeatedly contacted 50 times at only one duration per pair (○). Data (mean ± s.e.m. of 3-4 cell pairs) at the first plateau overlap. C, Three pairs of F5 T cells and NP68:H-2Db-coated RBCs (23 μm−2) were each contacted 100 times with durations alternating between 0.25 and 5 s to measure two mean Pa ± s.e.m. (one at each contact duration) by dividing the number of adhesions resulting from contacts of the same duration by 50 (solid bars), which were significantly different (p = 0.0056, Student t-test). However, no statistical differences (p > 0.25) were found for both 0.25 and 5 s groups between these Pa values and those measured using 10 pairs of cells from the same batch each consecutively contacted 50 times (open bars). See also Movie S2.

