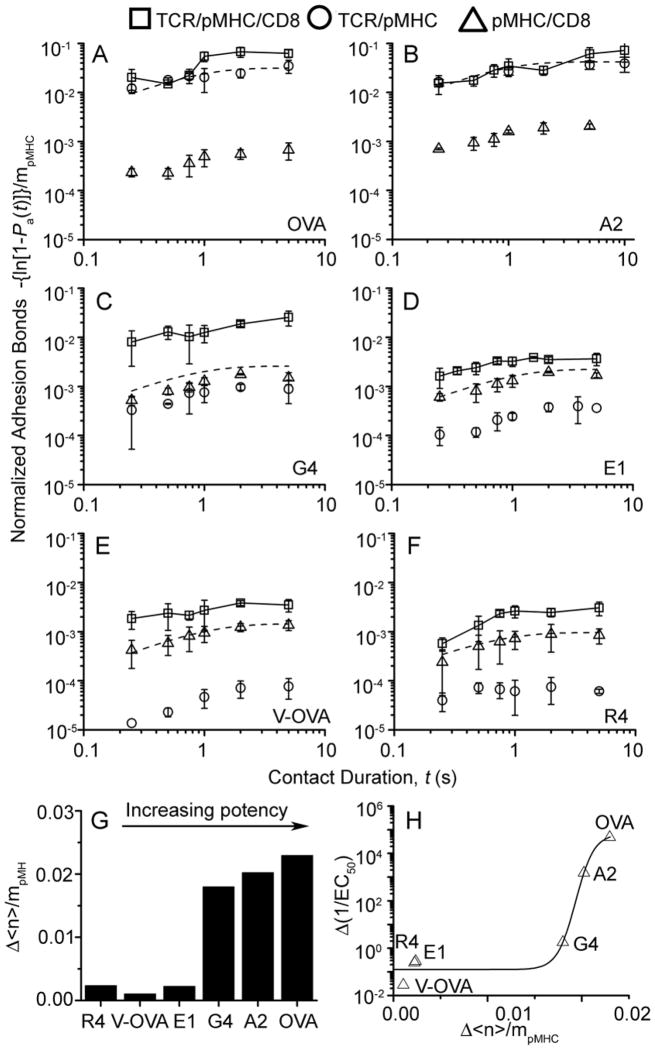
Figure 7. Synergy between TCR and CD8 amplifies T cell discrimination.
A–F, Pa vs. t data (measured by the same methods as that in Fig. 2) for OT1 T cells interacting with RBCs bearing H-2Kb (□) or H-2Kbα3A2 (○) complexed with OVA (A), A2 (B), G4 (C), E1 (D), V-OVA (E), and R4 (F). Also presented are data measured using RBCs bearing H-2Kb in the presence of the anti-TCR reagent B20.1 (△). Pa was converted to normalized adhesion bonds using Eq. 4 (Methods) and presented as mean ± s.e.m. Dashed curves represent trendlines to the sum of TCR-pMHC (○) and pMHC-CD8 (△) data. G, Steady-state (plateau values at 5 s) of the differential normalized adhesion bonds, △(<n>/mpMHC), formed between OT1 T cells and pMHC-coated RBCs minus the sum of those formed by the two bimolecular interactions for a panel of pMHC ligands with increasing potencies. H, The differential reciprocal concentrations required to reach half-maximal T cell proliferation △(1/EC50), measured in the absence of blocking antibody minus that measured in the presence of Fab of anti-CD8 mAb CT-CD8a, is plotted vs. △(<n>/mpMHC). See also Figure S5.

