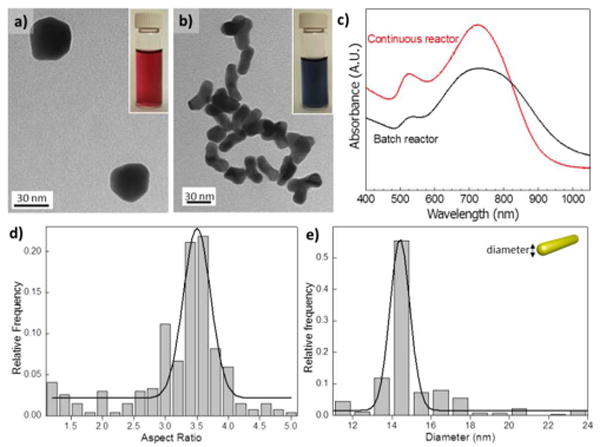
Fig. 2.

TEM images and absorbance spectra of the Au nanostructures. (a) TEM image of Au nanostructures obtained at Lys/Au molar ratio of 2, in a batch reactor. (b) At molar ratio of 180, in a continuous flow reactor. Insets of (a) and (b) Optical images from gold colloids obtained at different Lys/Au ratios. (c) Comparison of absorbance spectra from GNRs obtained in a batch reactor and continuous flow reactor (oxidant flow rate of 40 μL/min and reductant flow rate of 10 μL/min) with same Au/Lys molar ratio of 180. (d), (e) Statistical analysis of produced GNRs obtained in continuos flow: (d) aspect ratio and (e) diameter.
