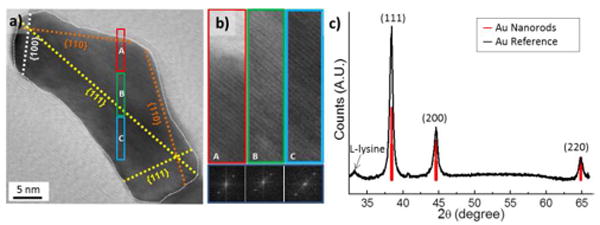
Fig. 3.

HR-TEM and XRD analysis of the gold nanorods. (a), (b) HRTEM image with lattice orientations; {111}, {100} and {110}. (b) HRTEM images correspond to the colored boxes A, B and C in (a) presented in the left. Right images show Fourier transform of A, B and C, respectively. (c) XRD spectrum from dried bulk GNRs (Black). Spectra from reference bulk gold (Red). Small sub-peak at 33° is attributed to crystalline L-lysine from the residue.
