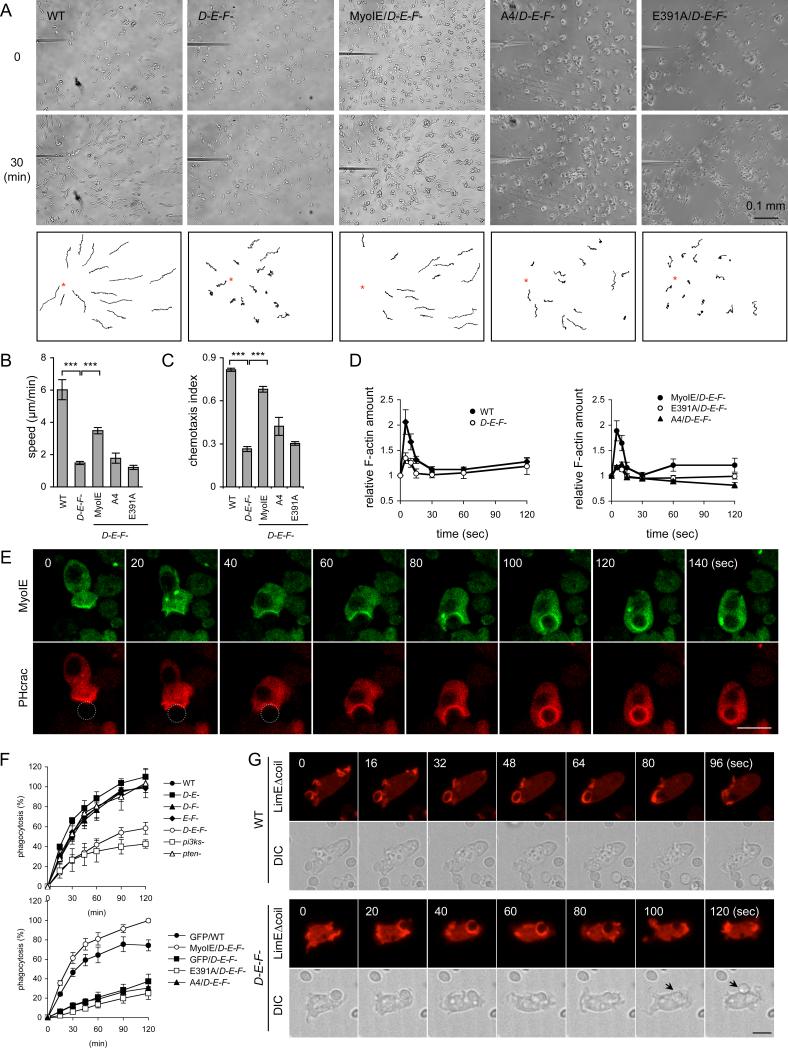
Figure 3. Myosins ID, IE, and IF function in chemotaxis and phagocytosis.
(A) The movement of wild-type cells and triple knockout cells expressing the indicated myosin IE constructs toward a micropipette containing cAMP was tracked. (B) Chemotaxis speed was calculated as the distance travelled towards the micropipette divided by the elapsed time (20 min) (n ≥ 3 experiments). (C) Chemotaxis index was defined as the distance traveled in the direction of the gradient divided by the total distance traveled in 20 min (n ≥ 3 experiments). At least 15 cells were analyzed in each experiment in (B) and (C). (D) cAMP-stimulated actin polymerization was determined in wild-type and triple knockout cells expressing the indicated myosin IE constructs. At the indicated time points after stimulation, 5×10⁶ cells were harvested and lysed, and amounts of F-actin were determined (36). Values represent the mean ± SEM from more than six independent experiments. (E) Localization of myosin IE-GFP and PHcrac-RFP was examined during phagocytosis. Circles indicate yeast cells in the first three time points. (F) Quantification of yeast uptake during phagocytosis. At the indicated time points, samples were collected and phagocytosed yeast cells were quantified. Values represent the mean ± SEM from more than four independent experiments. (G) Wild-type and triple knockout cells expressing LimEΔcoil-RFP were observed during phagocytosis of yeast cells. Arrows indicate yeast cells released from phagocytic cups.

