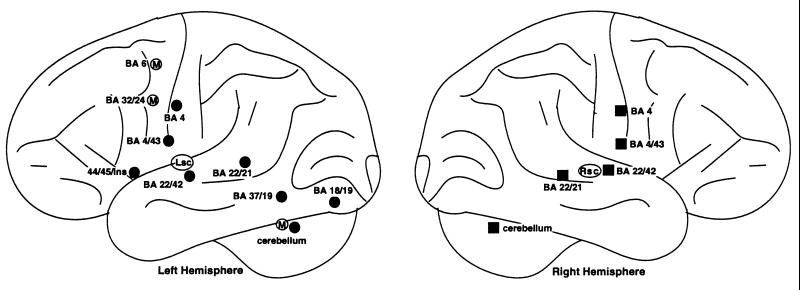
Figure 1.
Schematic diagram showing mean location of positive foci across studies of word reading (see Table 1). Foci in the right hemisphere are shown with filled squares, foci in the left hemisphere are shown with filled circles, three foci near the midline are shown in the left hemisphere with an “M,” and two subcortical foci near the thalamus, basal ganglia, and insular cortex are shown with “Lsc” and “Rsc.” It should be noted that these are only mean locations, that the distribution of locations in some cases covered a fairly wide range (as indicated by the standard deviations listed in Table 1), and that each mean location does not necessarily signify the center of a single functional area.

