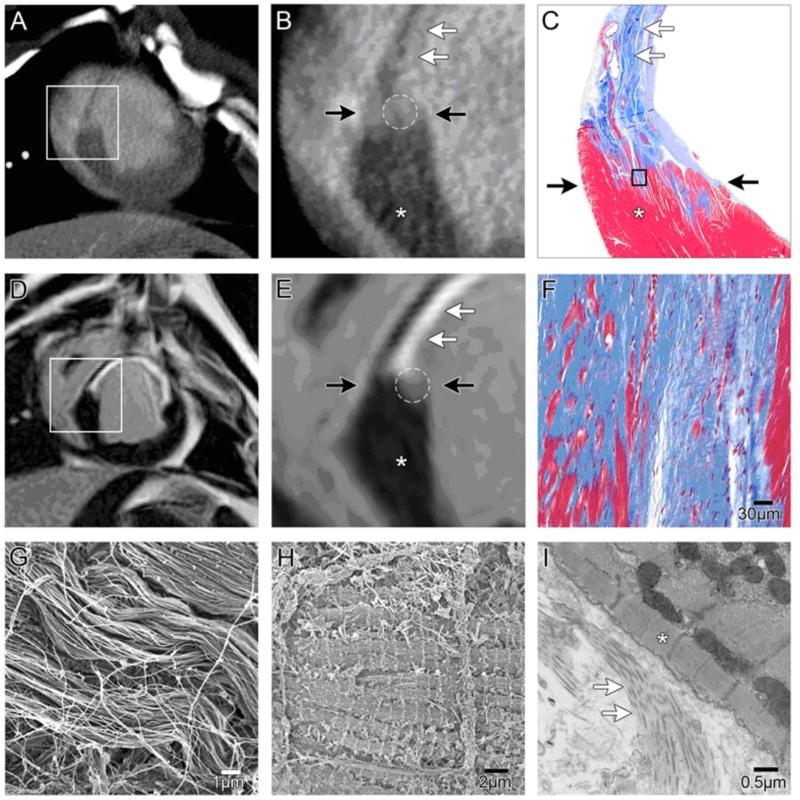
Figure 2. Characterization of tissue heterogeneity in peri-infarct zone by MDCT.
Example of matching 8mm slice section in chronic infarcts for de-MDCT (A, B) and de-MRI (D,E).(A, B) The viable myocardium(*) shows lower attenuation values, than enhanced scar tissue (white arrows). The PIZ is visualized between two black arrows by intermediate signal intensity (white circle) in de-MDCT images.
(D,E) Viable myocardium (*), delayed enhanced infarct scar (white arrows), and the PIZ (white circle) show different signal intensity in de- MRI. The viable myocardium is darker in the MRI acquisition, and the PIZ appears larger in de-MDCT images compared to de-MRI. C, F) Masson’s trichrome stain depicts viable myocardium in red (*) from non-viable tissue in blue. At higher magnification the densely packed collagenous extra-cellular matrix (white arrows) in the chronic infarct scar can be appreciated. Island of viable myocytes (red) within the scar tissue are visualized demonstrating the heterogeneity of the PIZ (area between black arrows). (G, H) Scanning electron microscope images of the densely packed collagen fibers six months post MI (G) and viable myocytes (H) characterize the ultra-structure of the chronic infarct and the PIZ. (I) Transmission electron microscopy of the PIZ demonstrates the clear delineating of the collagenous scar (white arrows) and viable tissue (*).

