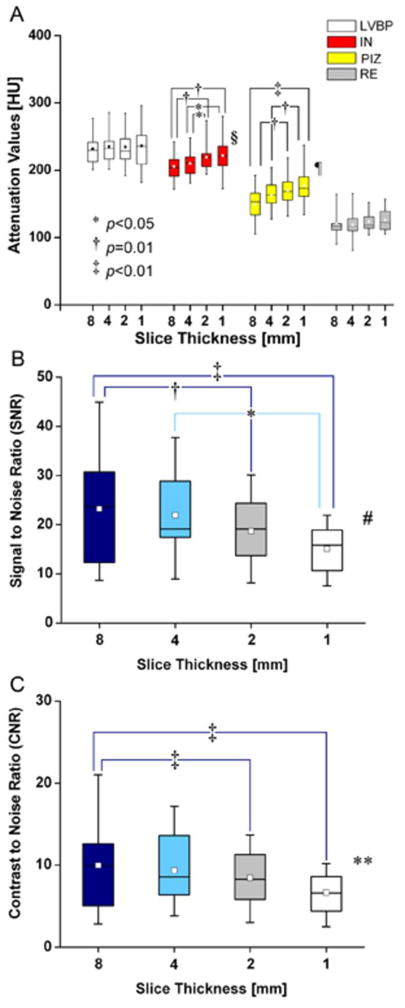
Figure 6. Effect of slice thickness on de-MDCT density and signal to noise ratios (SNR) and contrast to noise ratios (CNR).(.

A) Signal density in Hounsfield Units (HU) for the left ventricular blood pool (LVBP), infarcted myocardium (IN), the peri-infarct zone (PIZ) and the remote myocardium (RE), LVBP and RE do not show different attenuation values at different slice thickness, while IN values (*p<0.05, 1 versus 4mm and 2 versus 4mm; † p=0.01,1 versus 8mm, 2 versus 8mm) and PIZ values (‡ p<0.01, 1 versus 4mm and 8mm, and 2 mm versus 8mm)change with the reconstructed slice thickness parameters(§p=0.007 and ¶ p=0.002, respectively). (B) Mean MDCT SNR (8 versus 2mm and 1mm, († p=0.01 and ‡ p<0.01 respectively; and 4 versus 1mm, *p<0.05; ‡ p=0.003) and (C) mean MDCT CNR (8 versus 2mm and 1mm, ‡ p<0.01; ** p=0.008) change with the reconstructed slice thickness, which reflects reduced imaging quality of thinner reconstructed slices.
